Norbert Petrovici with Studio Interrobang and Victor Ionichi
Romania’s textile sector has undergone significant transformation, mirroring global shifts in production and economic. This series of infographics illustrates these changes, based on the research report ‘Shifts in Global Textile Markets: Romania’s Role in the Global Value Chain from 1962 to 2022’.
In the late 20th century, Romania emerged as a key player, contributing notably to global supply chains with both intermediate and highly complex textile products. During the 1990s and early 2000s, the industry thrived by integrating into a global network, producing essential intermediate goods and high-value finished products. Romania leveraged its capacity for both cost-effective and technologically advanced production, establishing a strong presence in textile markets.
However, the rise of major Asian textile exporters and economic changes following the 2008 global financial crisis led to a restructuring of the global textile landscape. Romania’s market share declined as Asia’s dominance increased, reflecting the global shift in production caused by heightened competition.
Today, Romania remains a significant player in the textile sector, focusing on high-value consumer goods and intermediate products crucial for industries such as automotive and furniture. The country’s position underscores its adaptability and continued relevance in specialised textile markets, demonstrating its resilience and importance in the global textile industry.
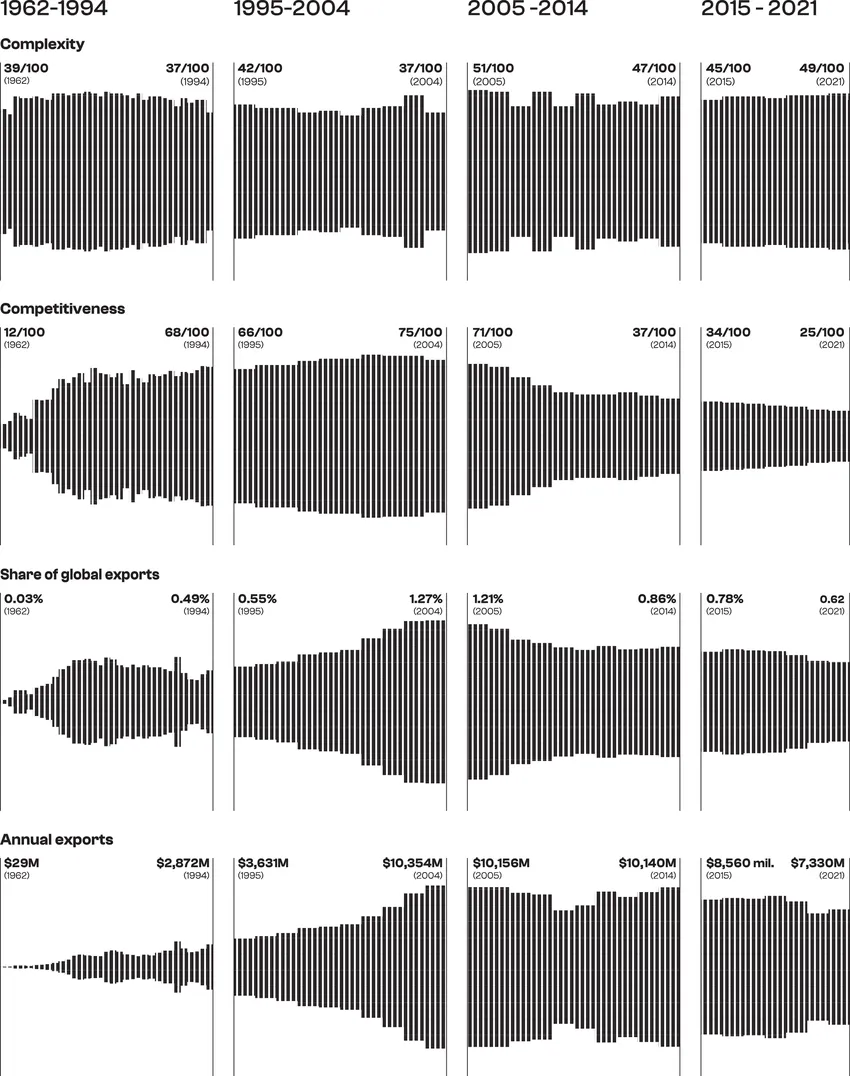
The Romanian textile industry in numbers
Area charts depicting the evolution of Romania's textile industry from 1962 to 2021 across four key periods, highlighting trends in export complexity, competitiveness, share of global exports, and annual export values in million USD. Each period reveals shifts in industry dynamics and Romania’s role in the global textile market.
Data source: Data source: Growth Lab at Harvard University, The Atlas of Economic Complexity. (2024). Retrieved from https://atlas.cid.harvard.edu/
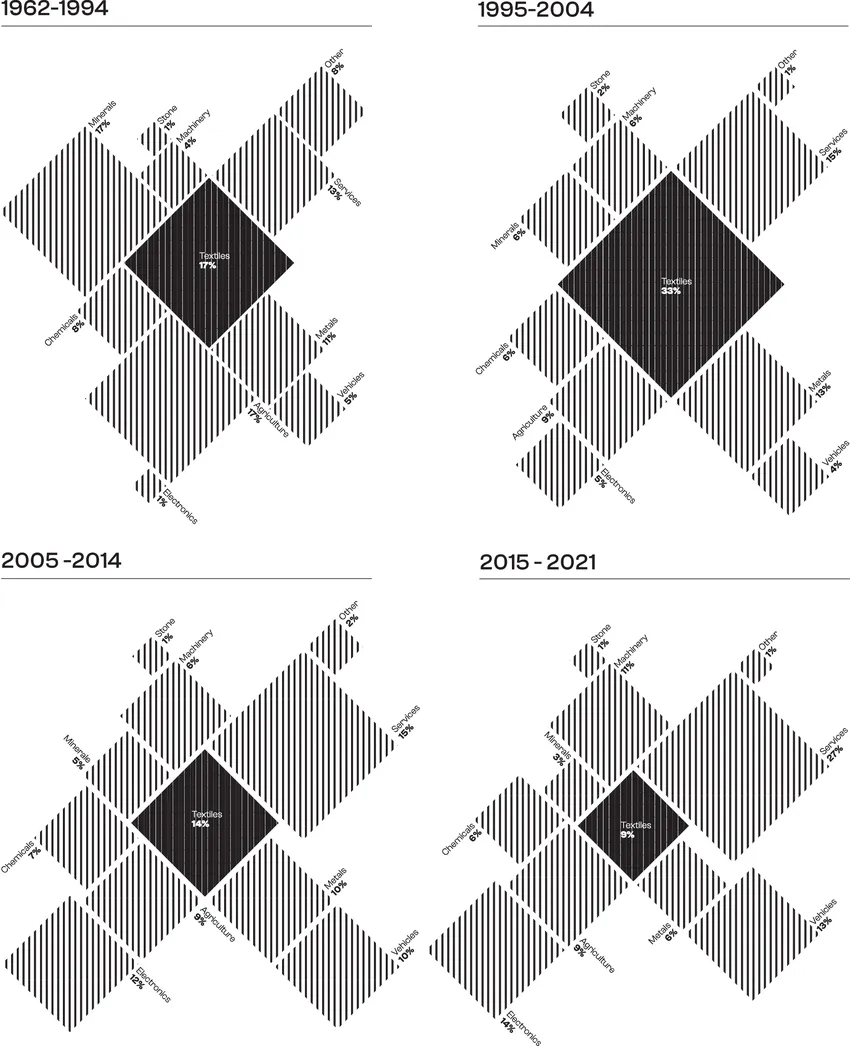
Romania’s exports by economic sector
Tree maps illustrating Romania's export composition by economic sector over four periods, highlighting the textile industry's changing share. Textiles dominated with 33% between 1995 and 2004, but by 2021, services lead with 27%, while textiles fall to only 5%.
Data source: Data source: Growth Lab at Harvard University, The Atlas of Economic Complexity. (2024). Retrieved from https://atlas.cid.harvard.edu/
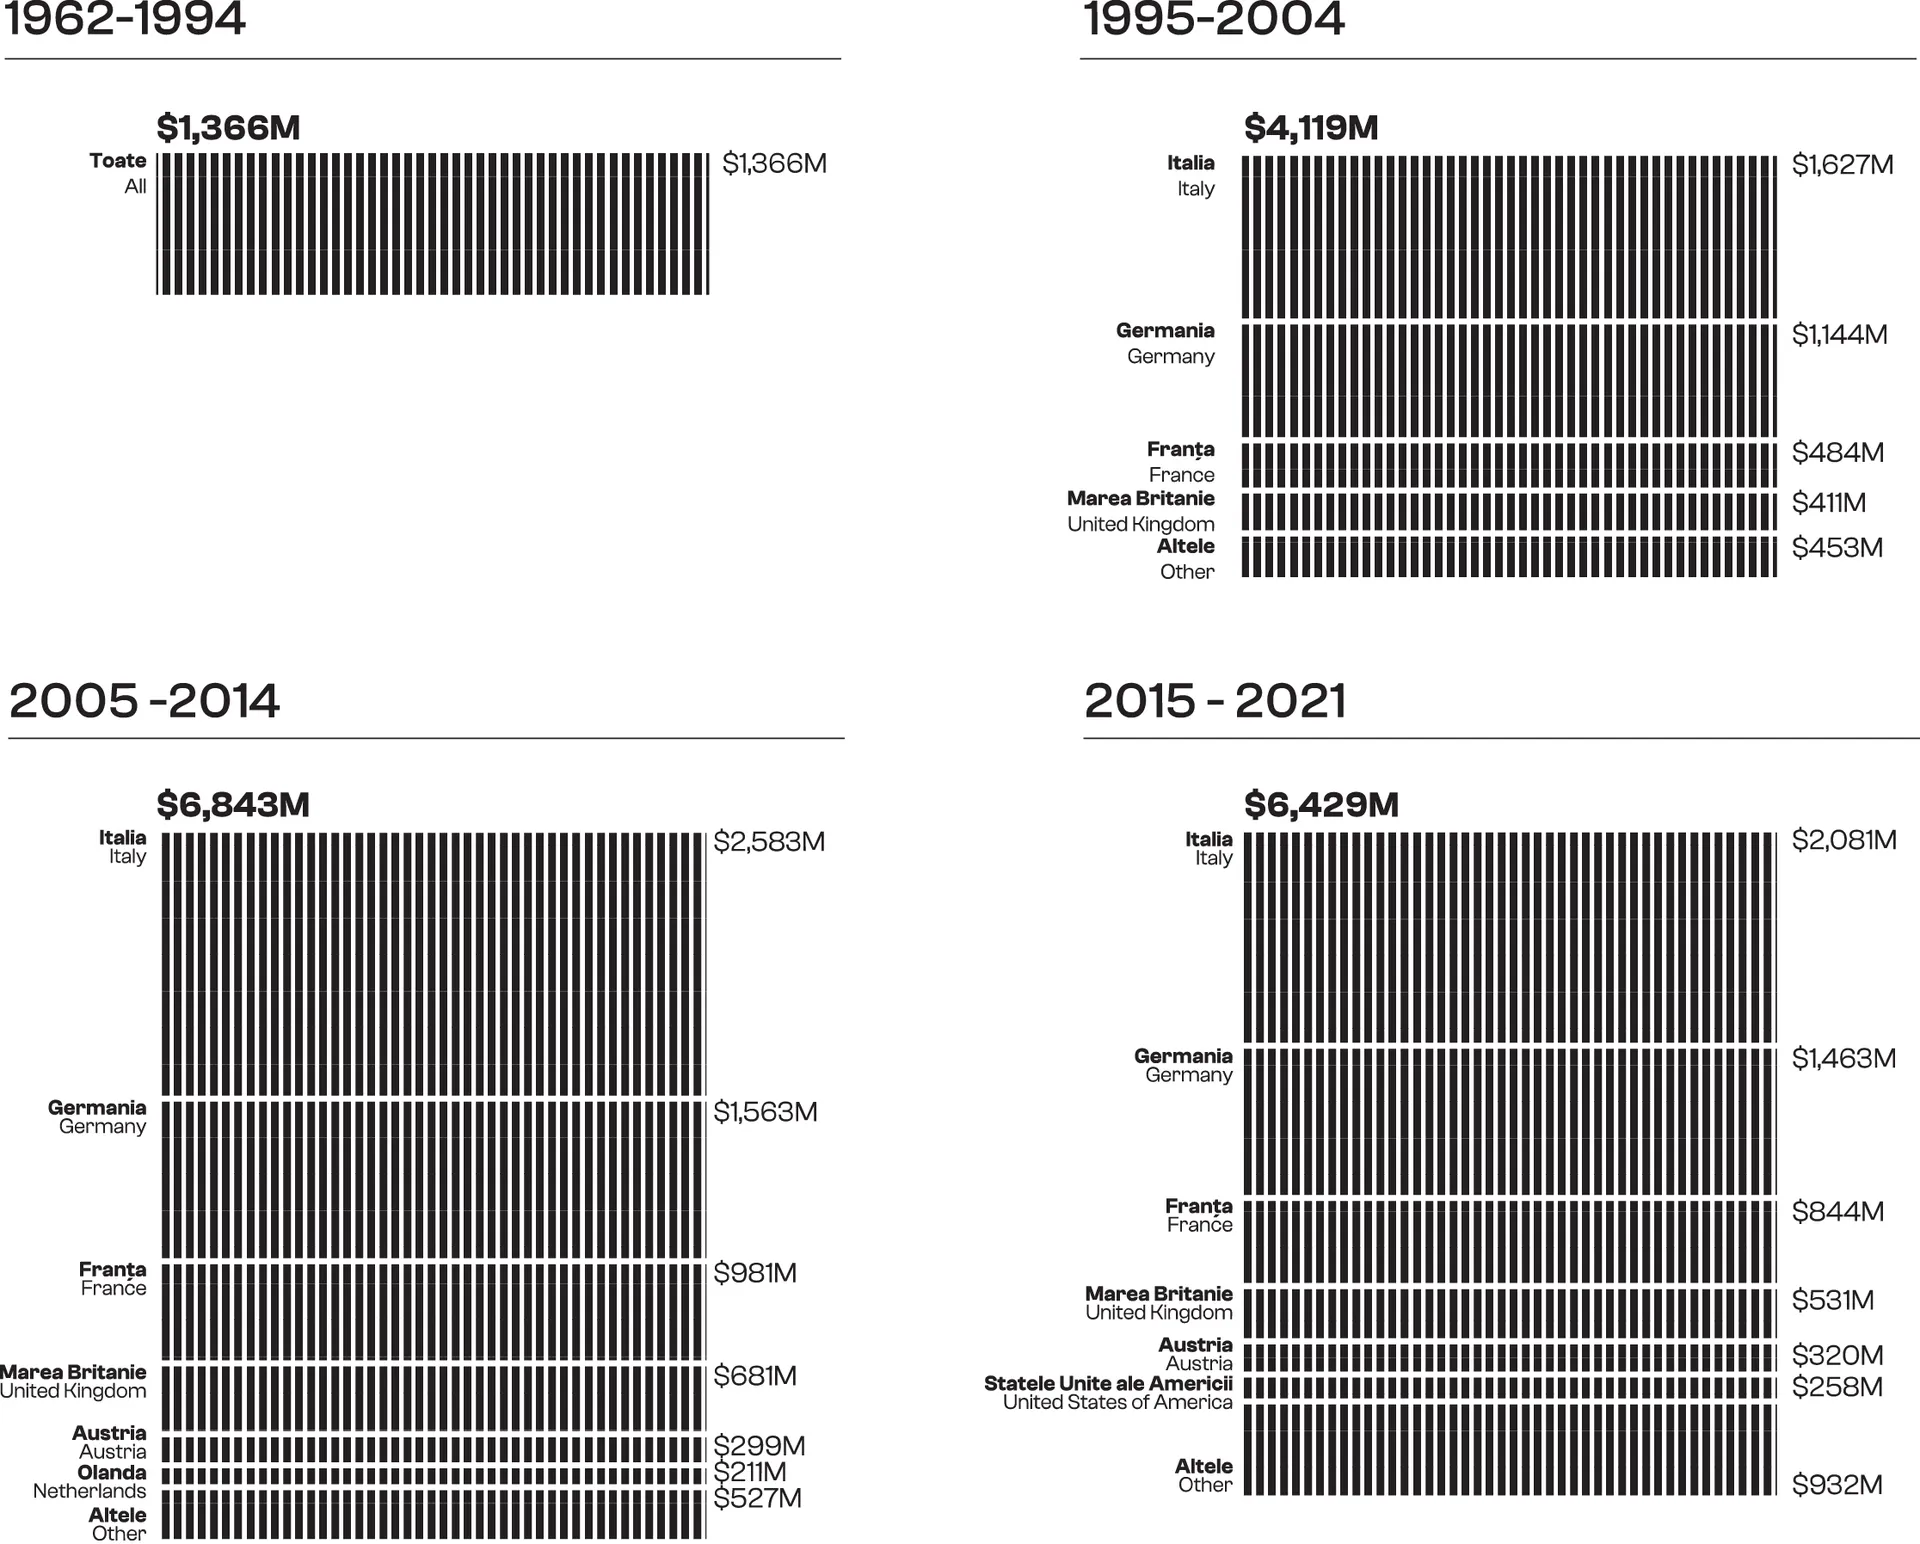
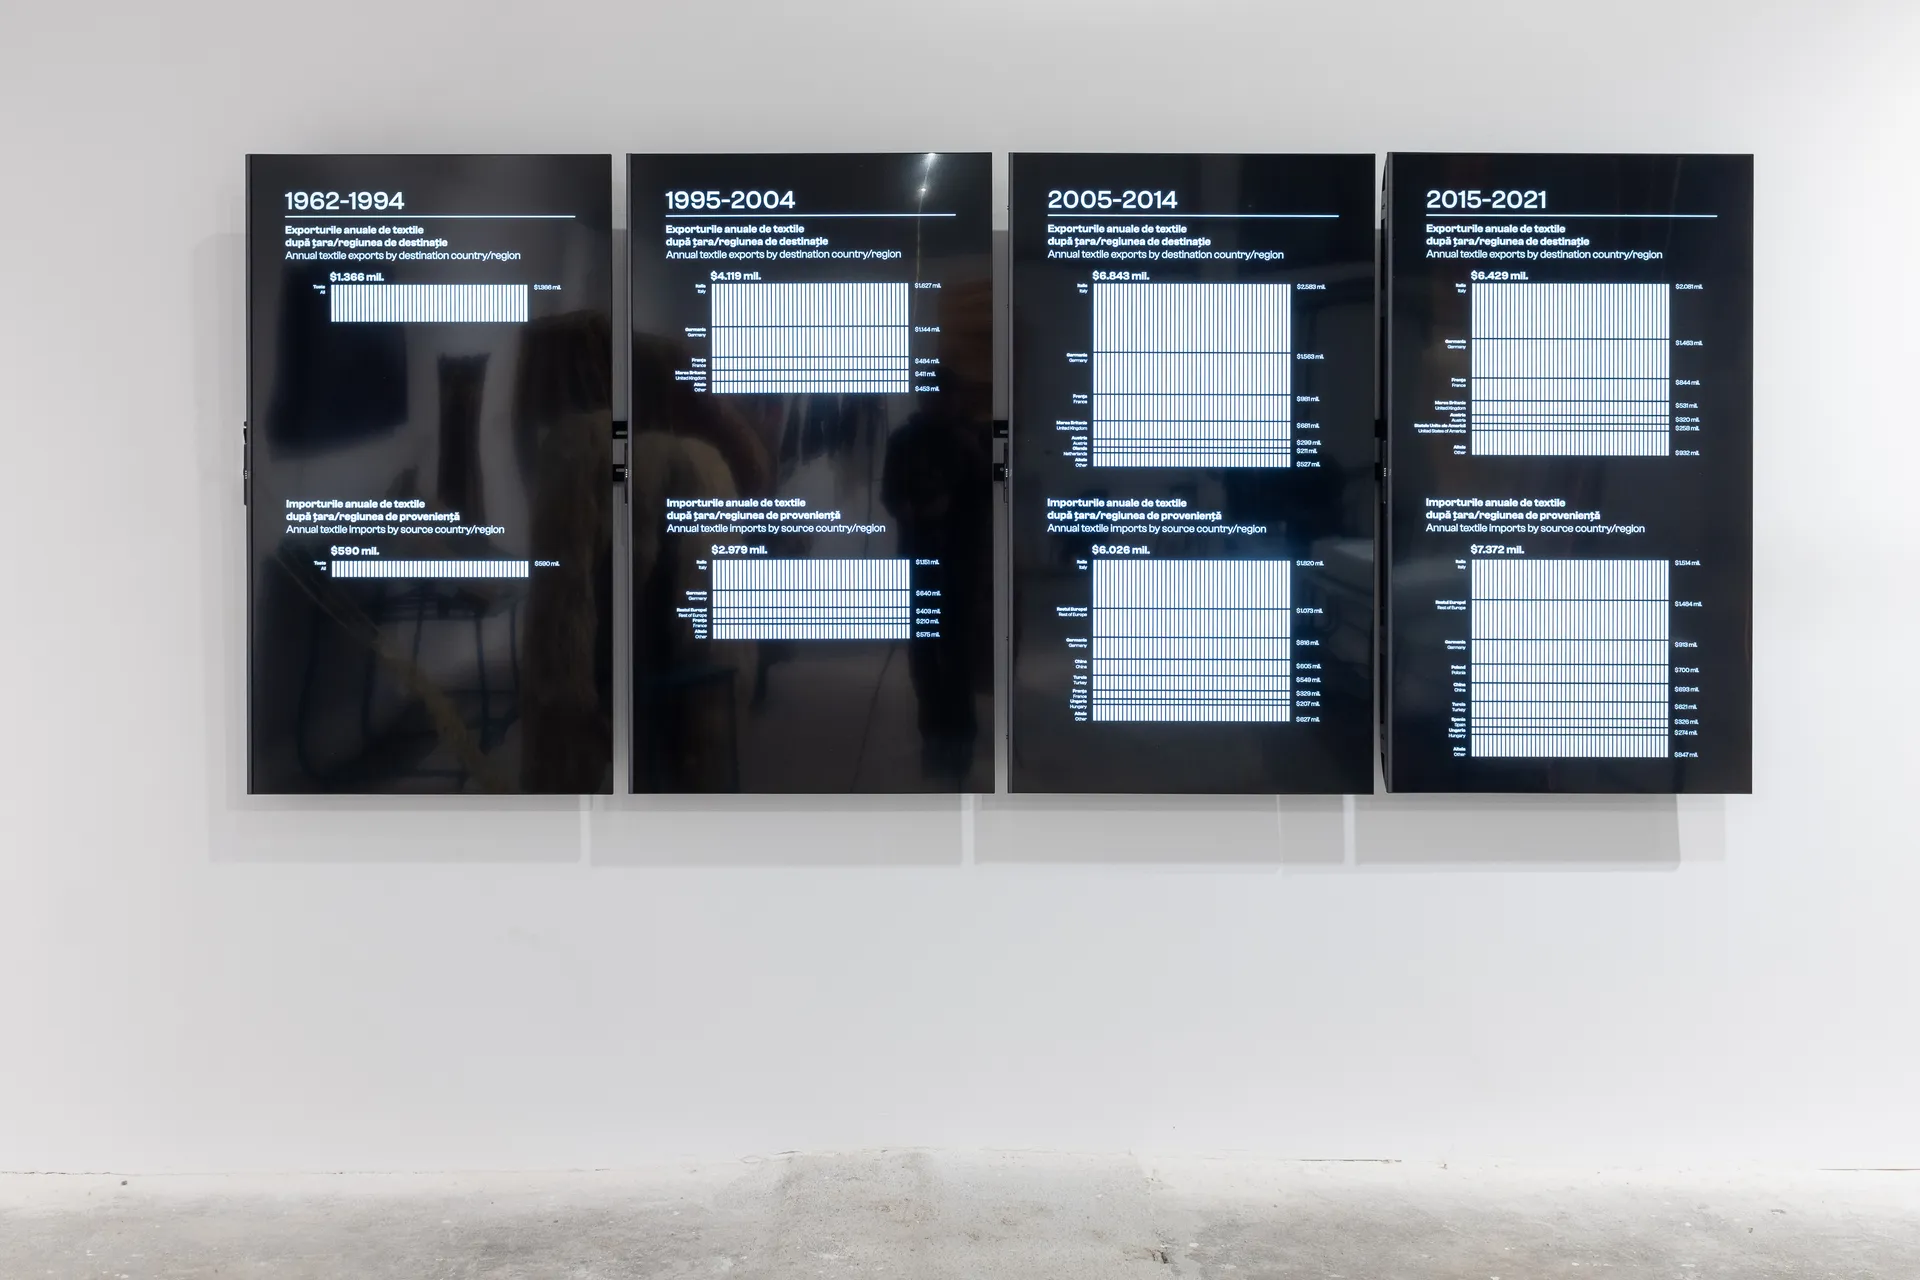
Annual textile exports by destination country / region
Stacked bar charts depict changes in Romania's textile export destinations, with Italy, Germany, and France remaining top markets from 1995 to 2021.
Data source: Data source: Growth Lab at Harvard University, The Atlas of Economic Complexity. (2024). Retrieved from https://atlas.cid.harvard.edu/
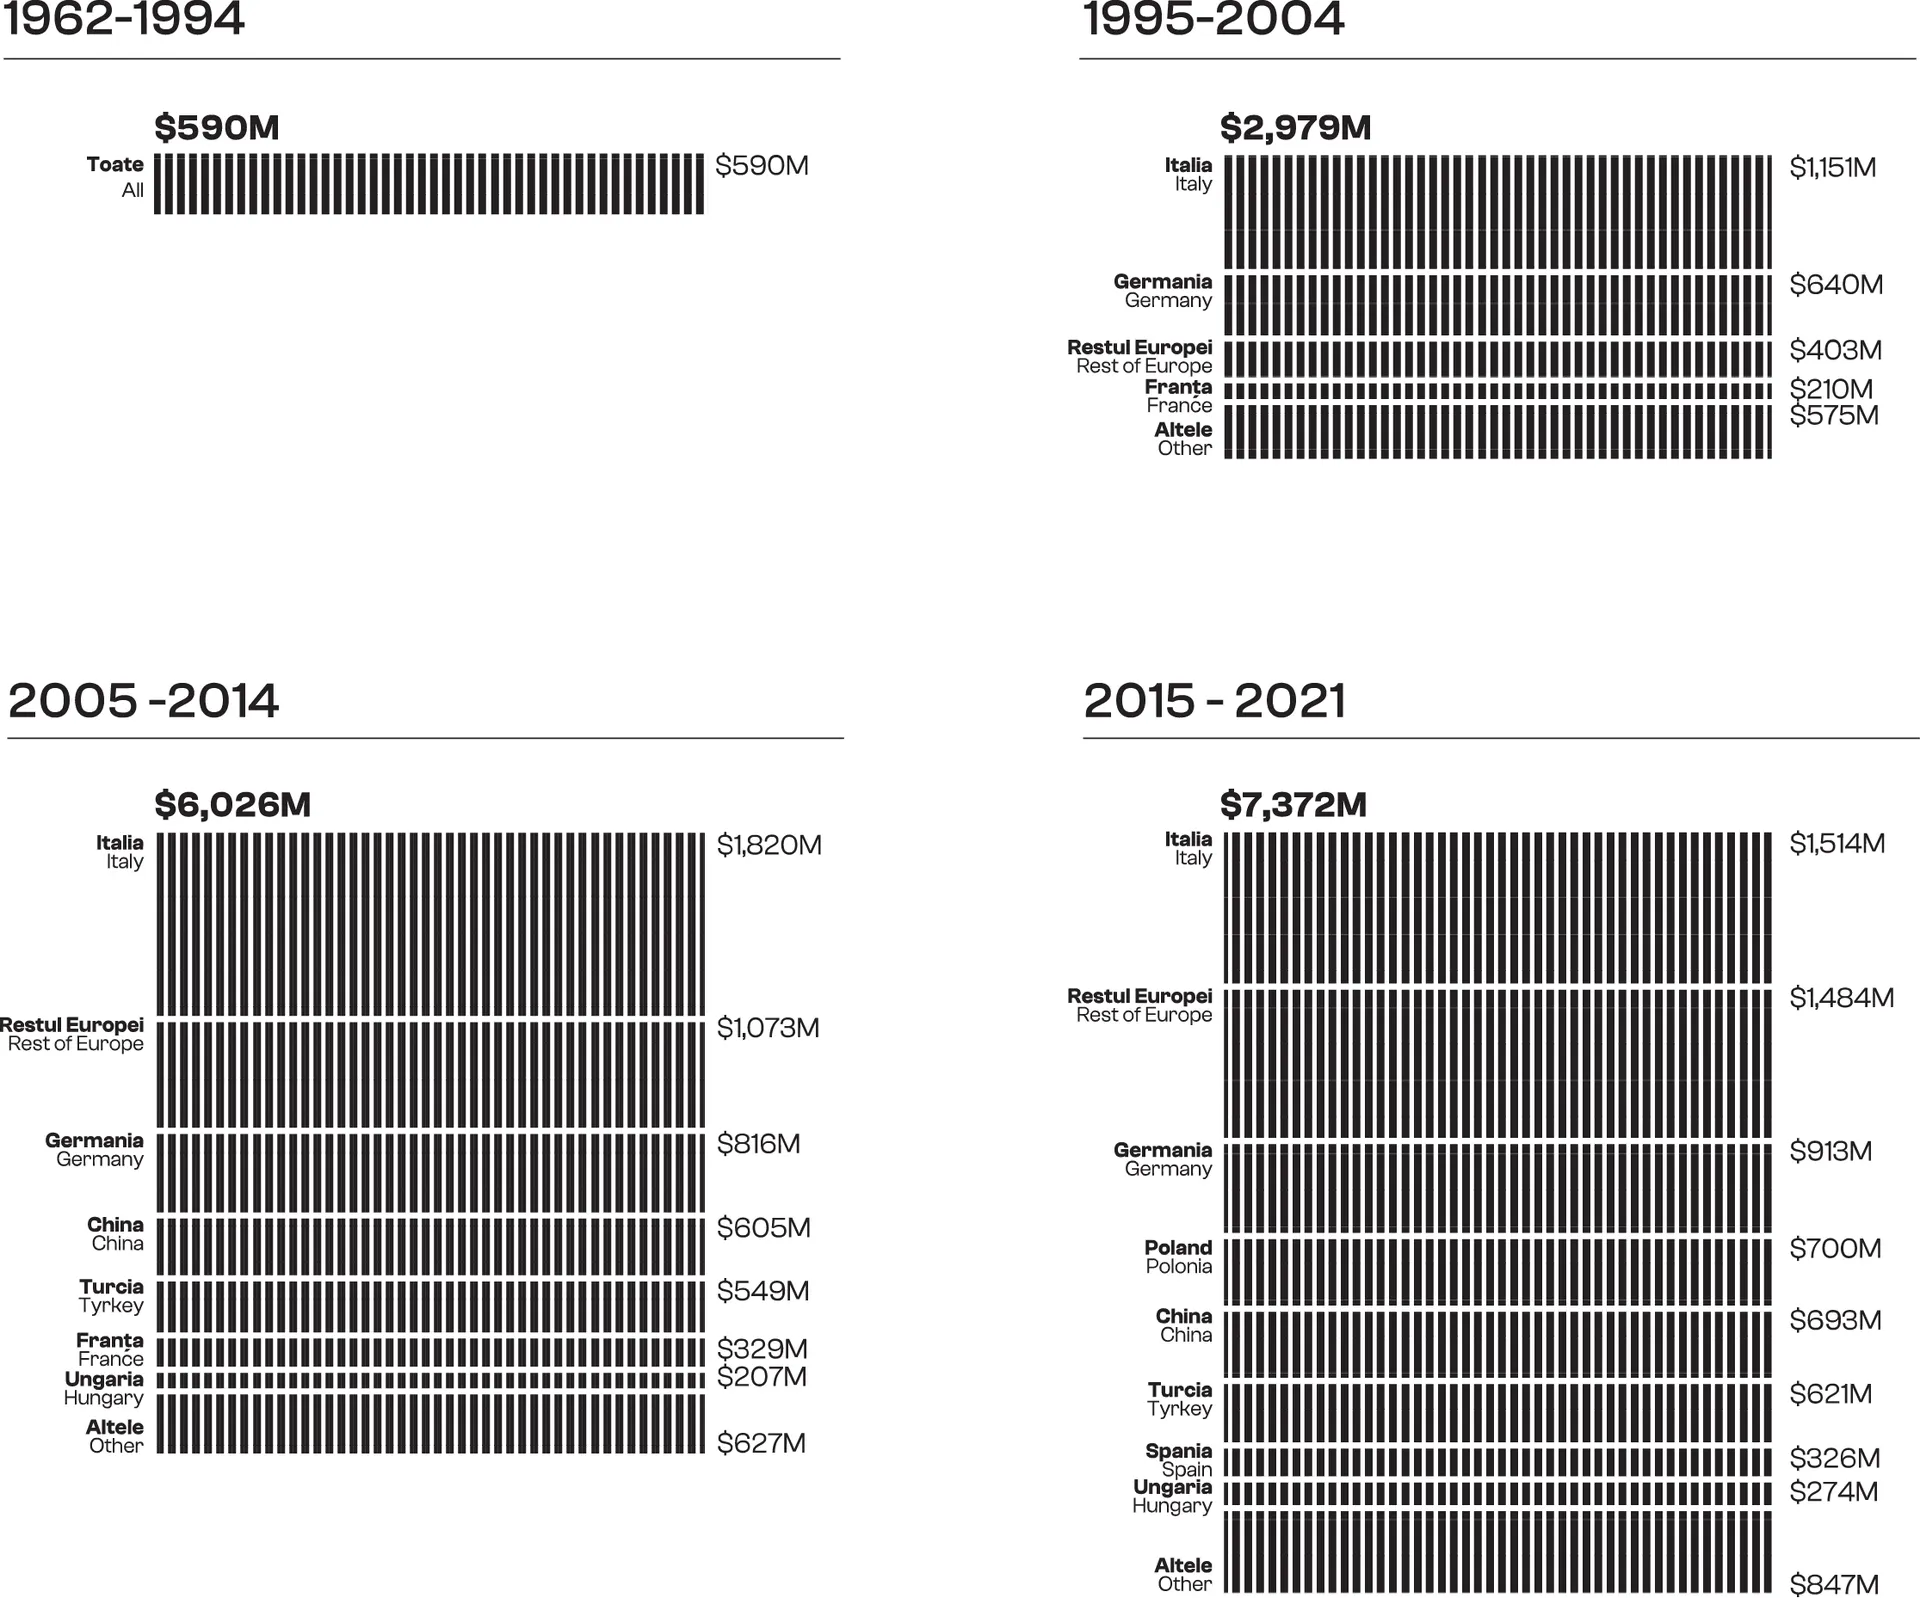
Annual textile imports by country / region of origin
Stacked bars show Romania's textile import origins, with Italy as the main source throughout, and a notable rise in imports from China over the last period, surpassing other European countries.
Data source: Data source: Growth Lab at Harvard University, The Atlas of Economic Complexity. (2024). Retrieved from https://atlas.cid.harvard.edu/
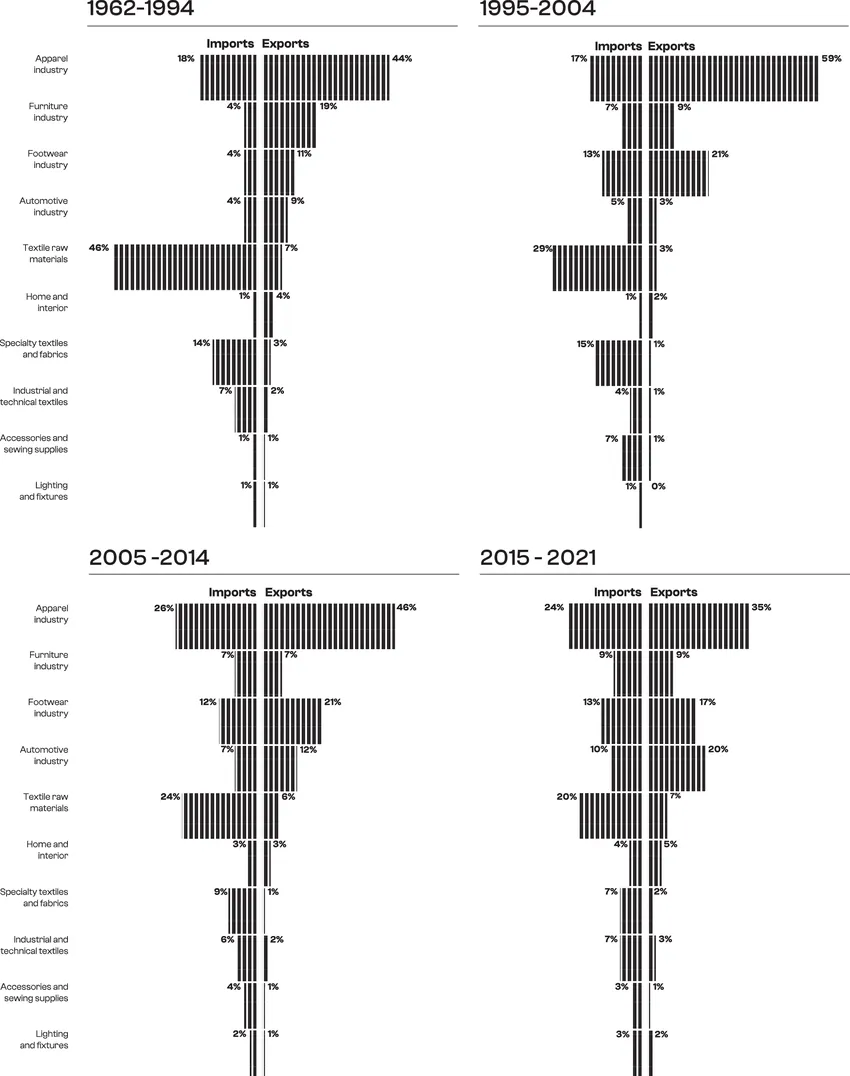
Share of imports and exports by textile industry sector
Chart detailing shifts in Romania's textile trade composition, with early dominance of raw materials in imports and apparel in exports, later giving way to increased imports in apparel and export growth in automotive and footwear sectors.
Data source: Data source: Growth Lab at Harvard University, The Atlas of Economic Complexity. (2024). Retrieved from https://atlas.cid.harvard.edu/
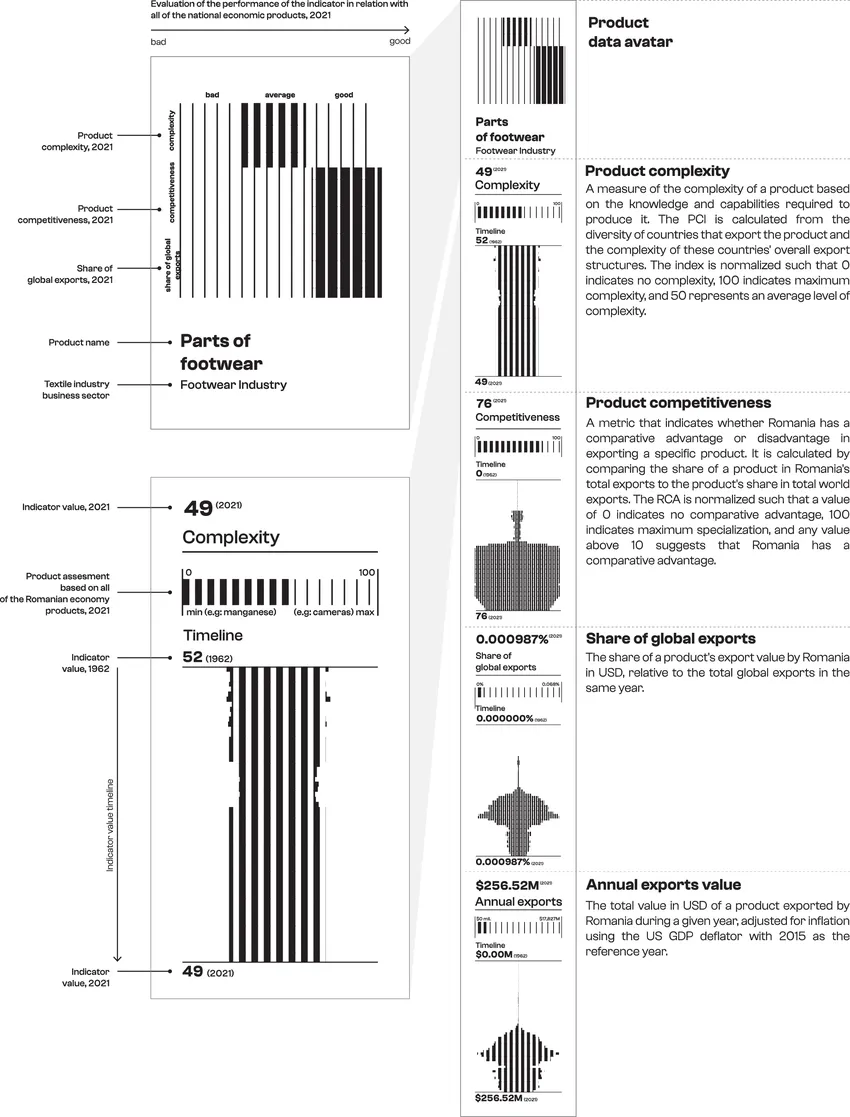
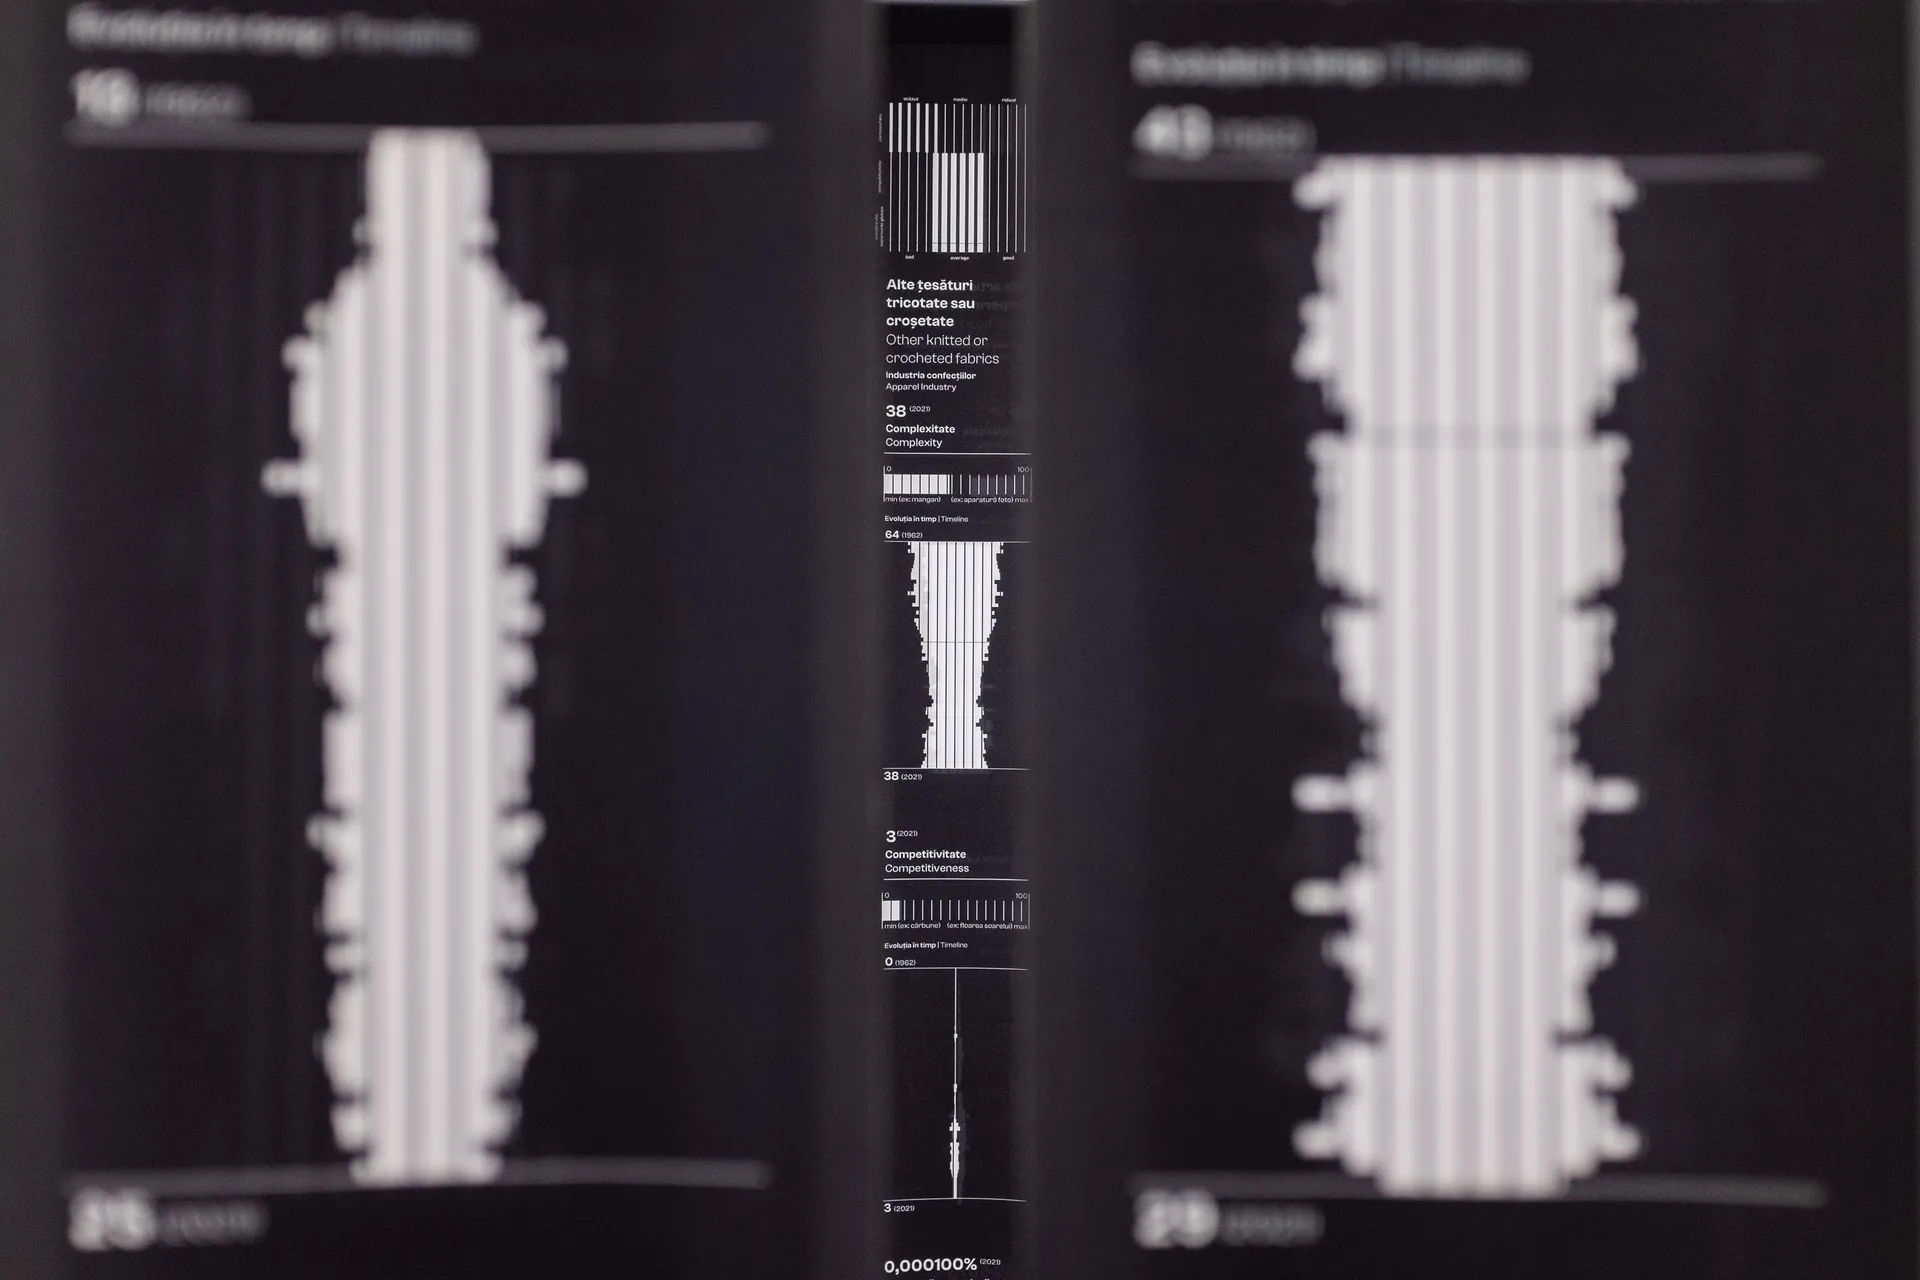
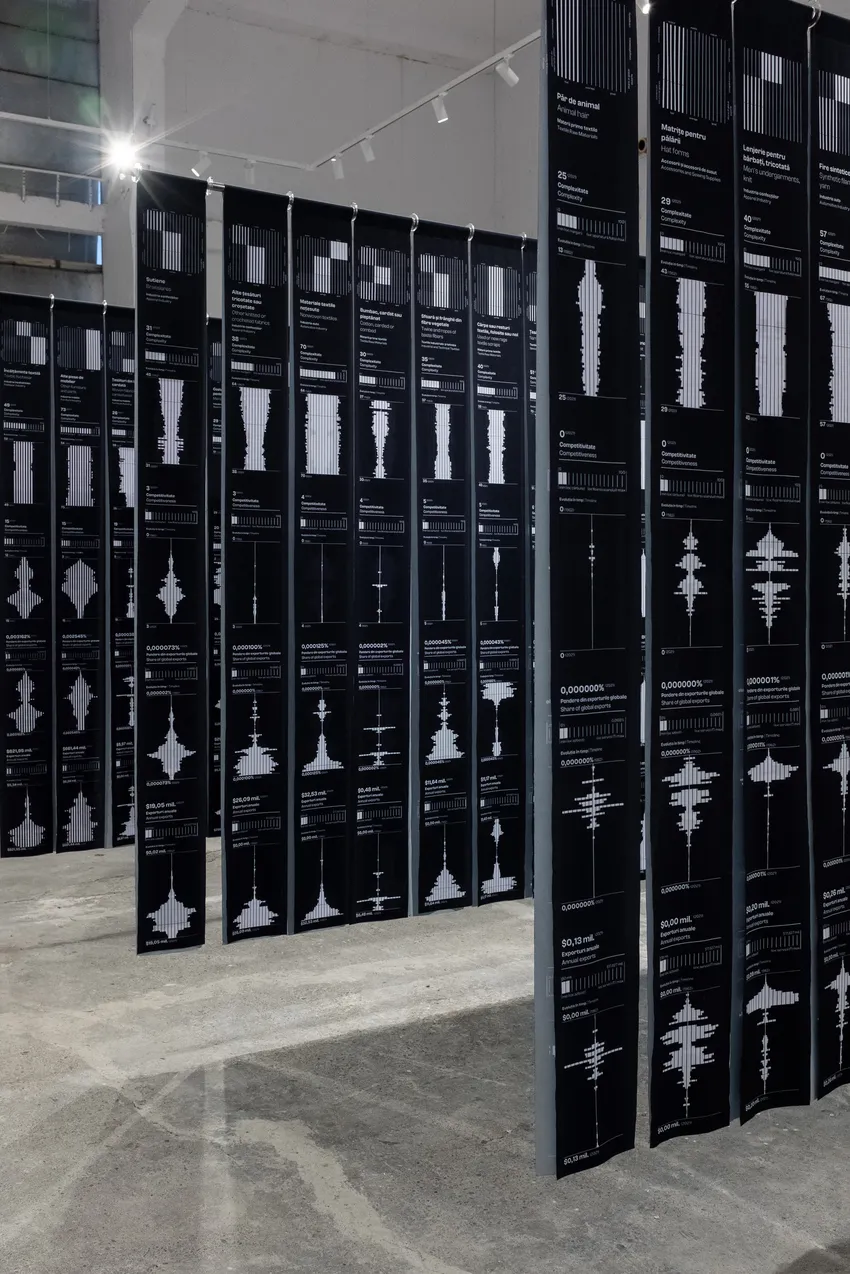
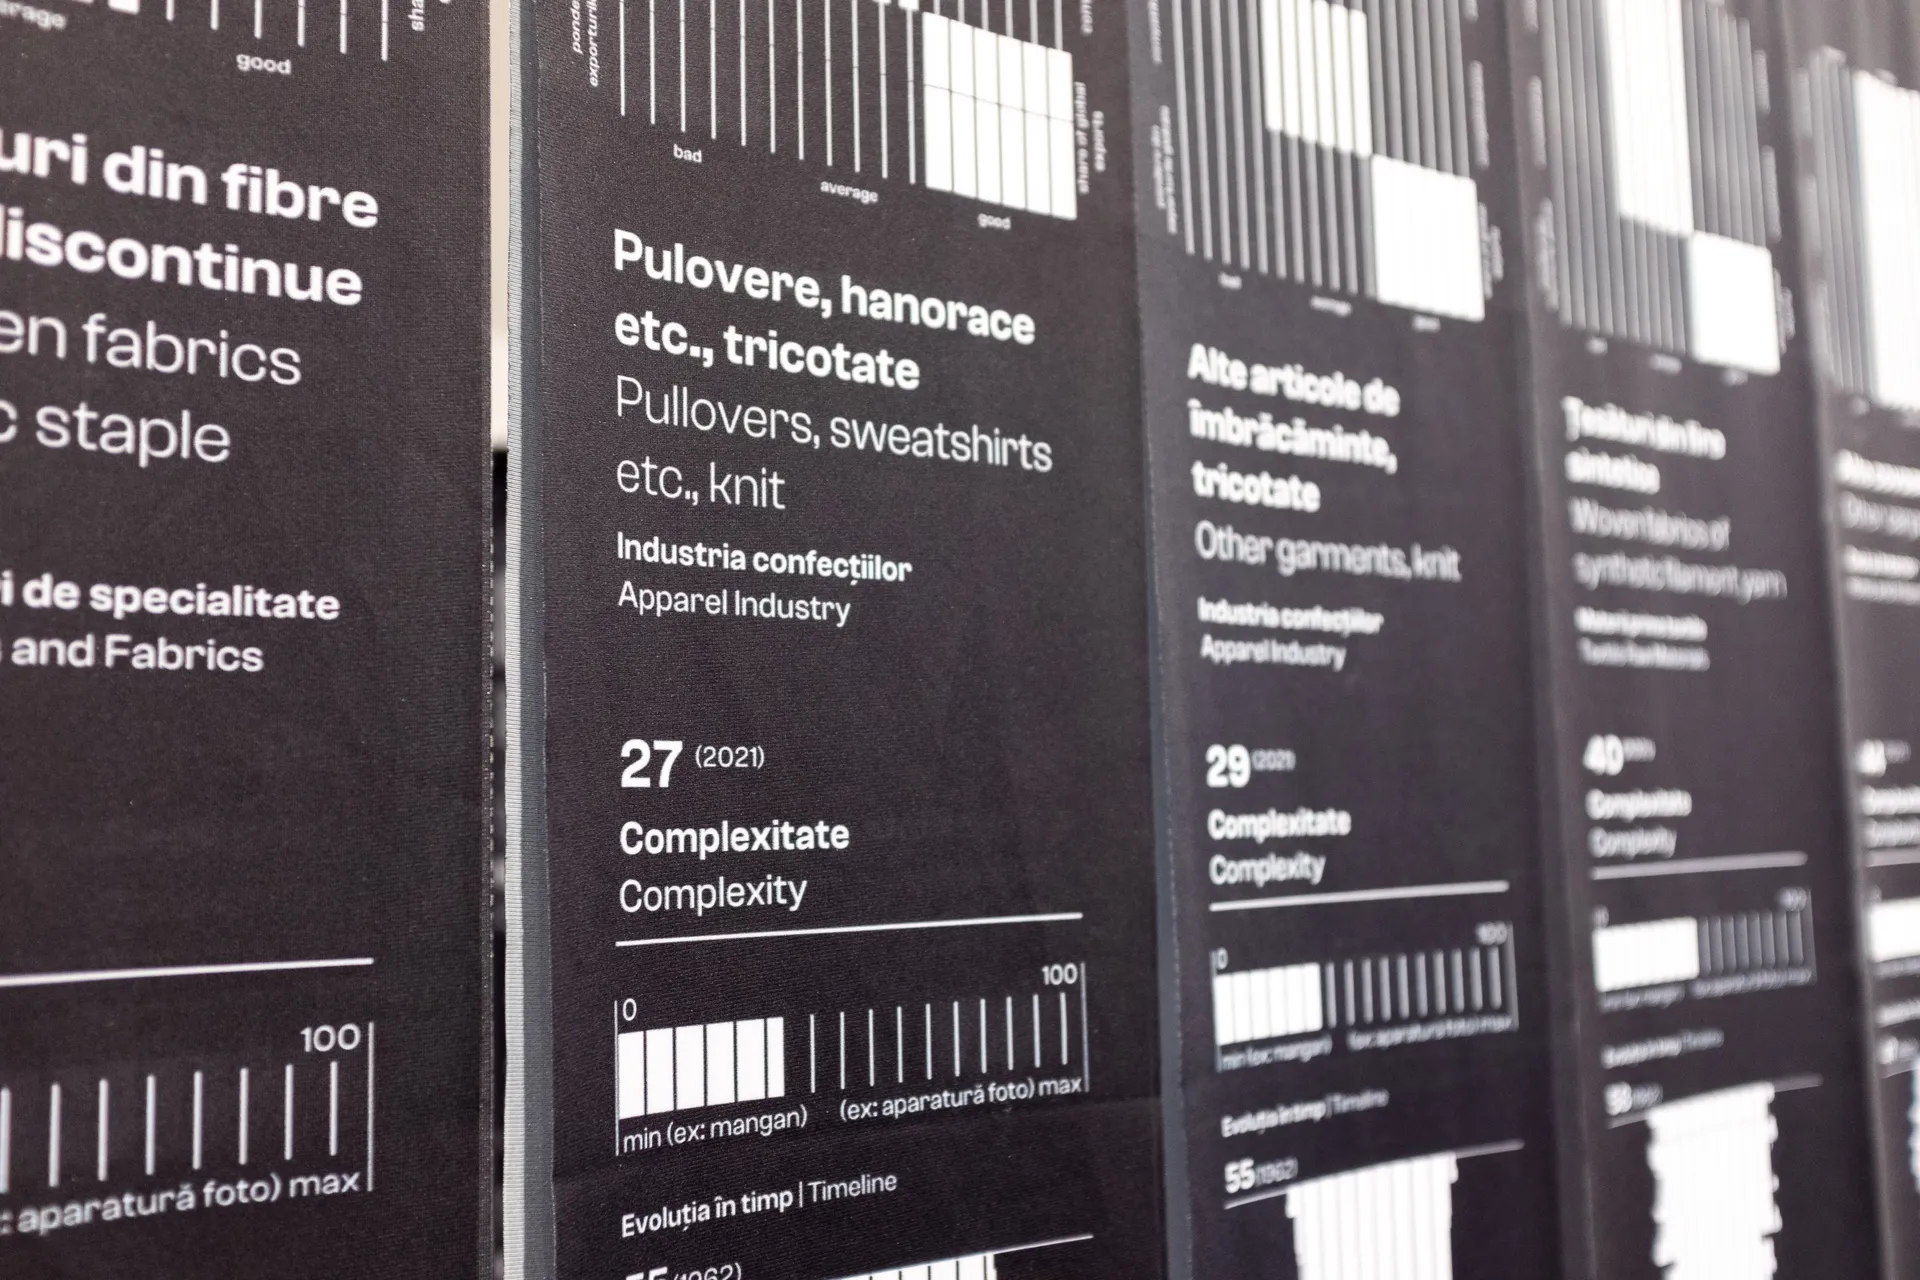
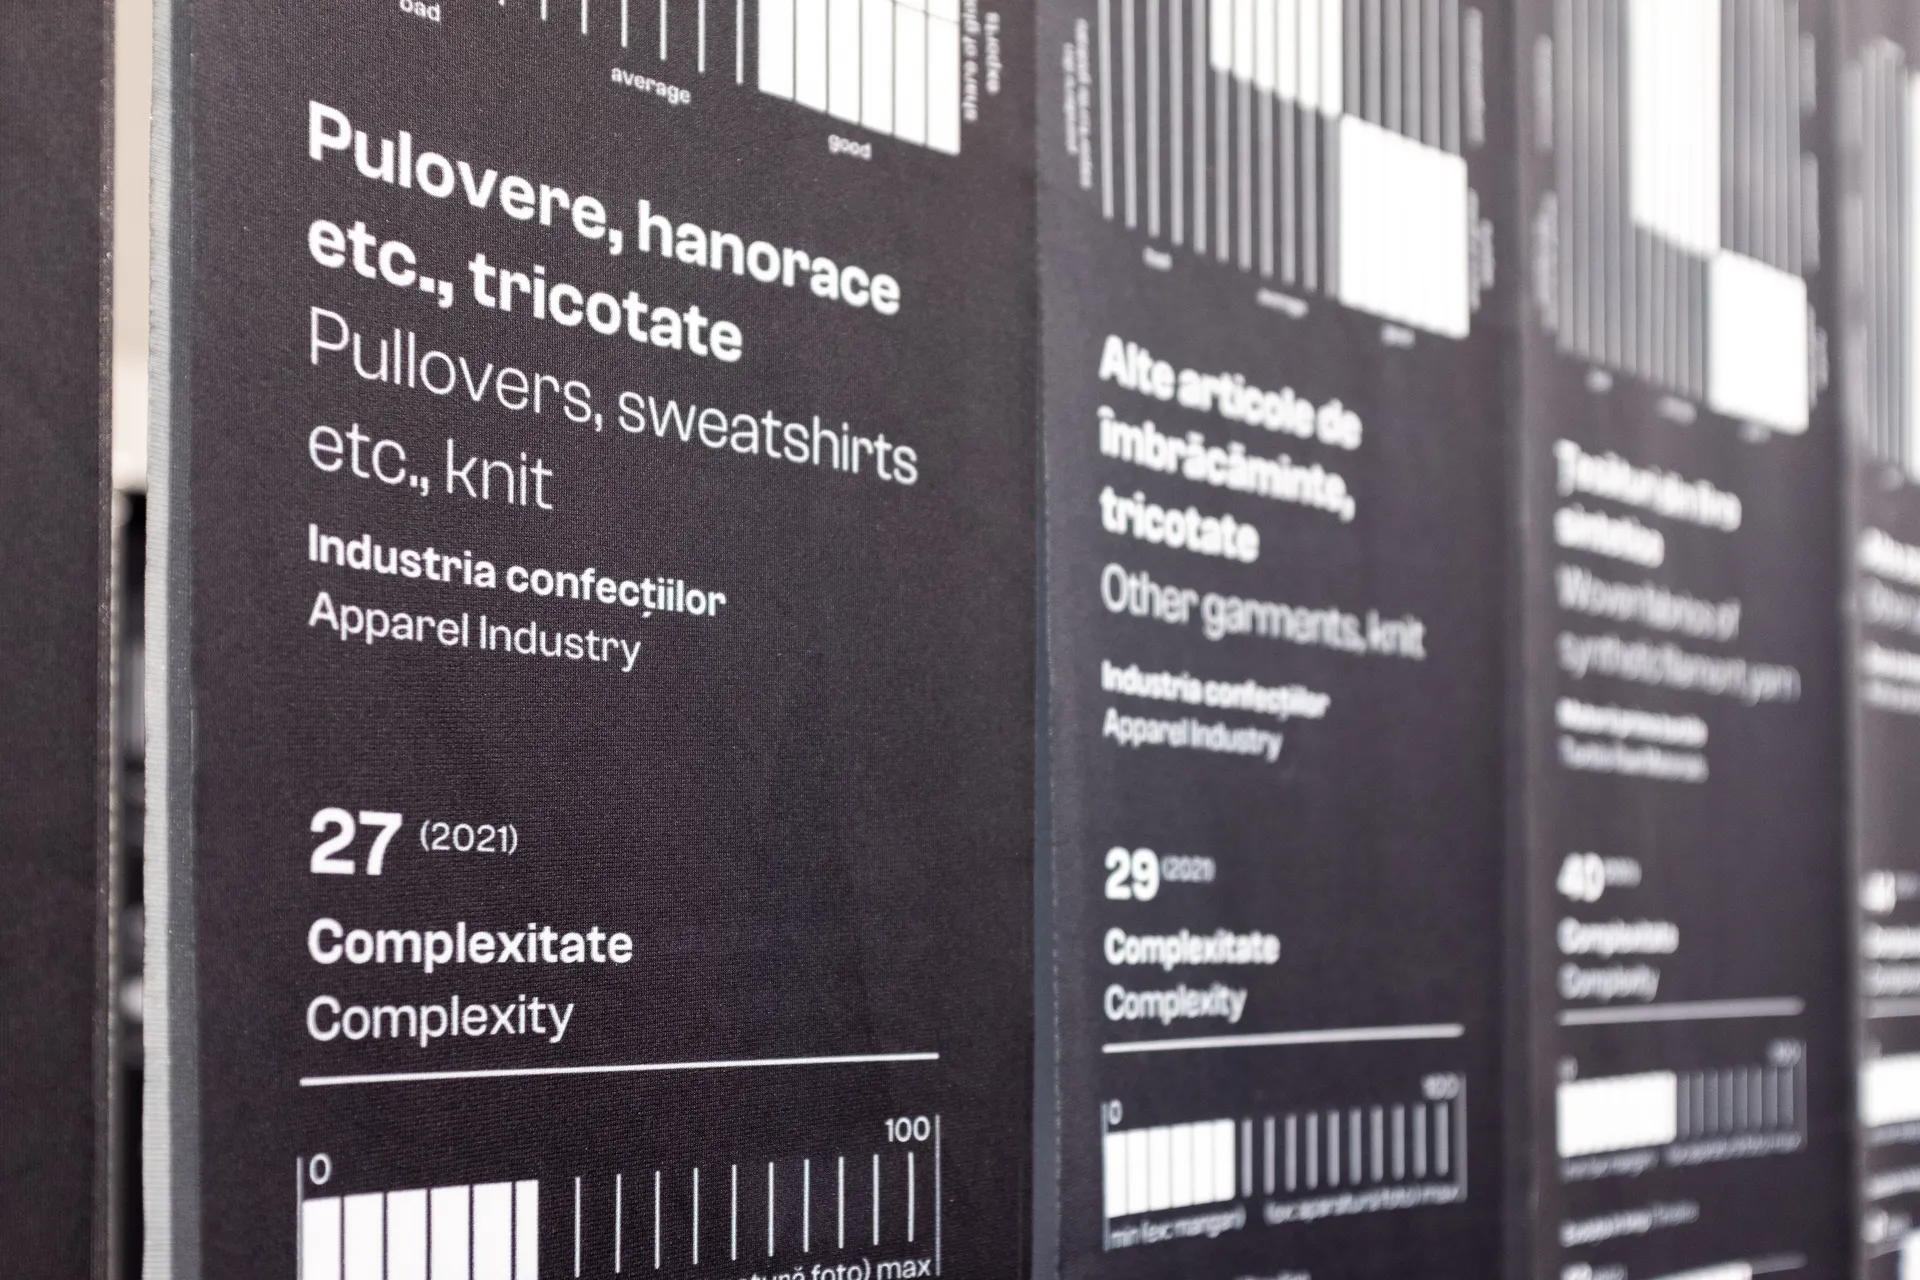
Product label - detail
Detailed label for one of the 84 products of the Romanian textile industry, illustrating 2021 data on export complexity, competitiveness, global share, and annual export value.
Data source: Data source: Growth Lab at Harvard University, The Atlas of Economic Complexity. (2024). Retrieved from https://atlas.cid.harvard.edu/
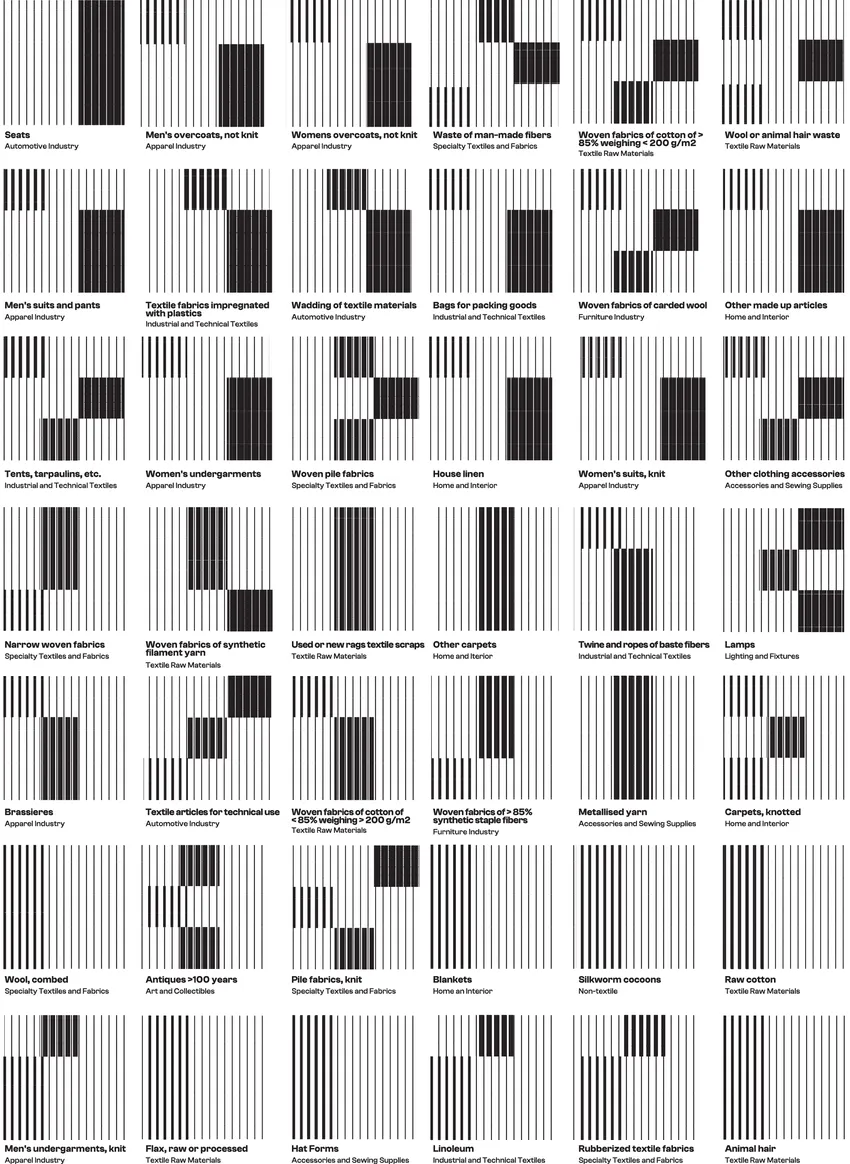
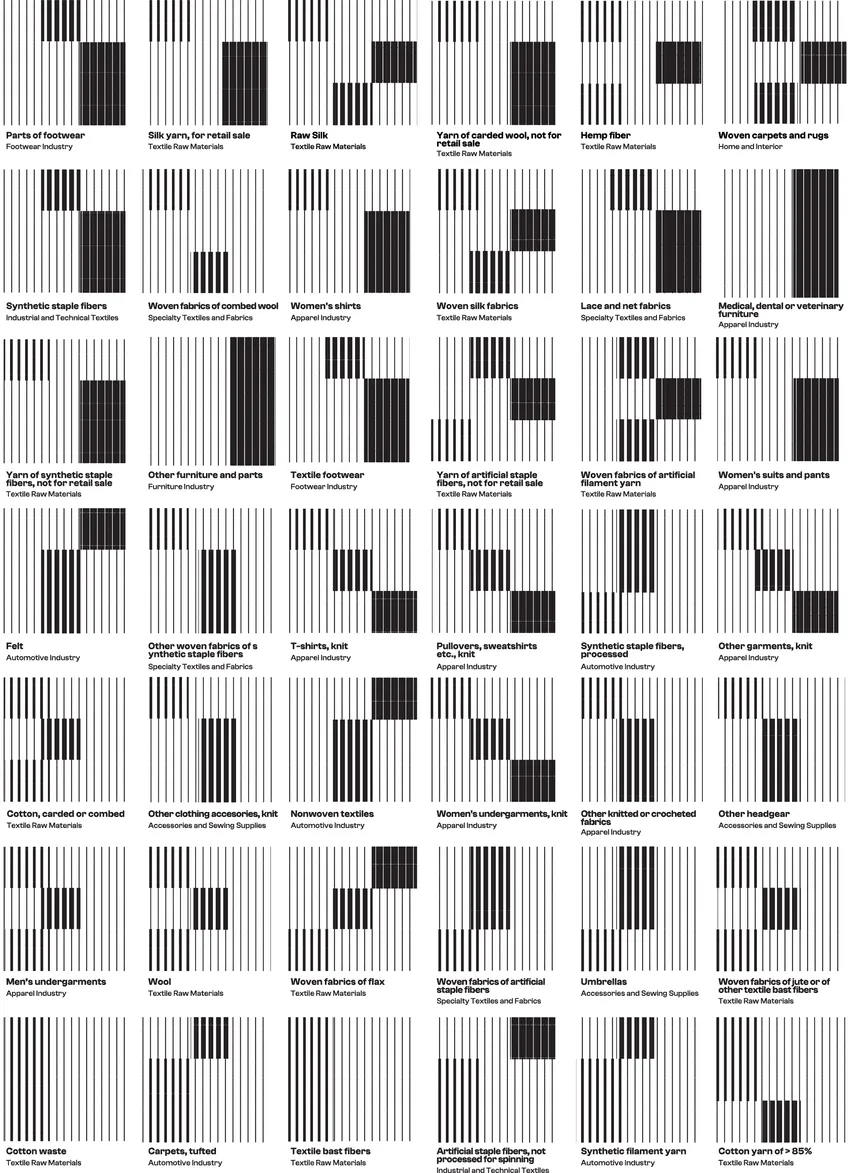
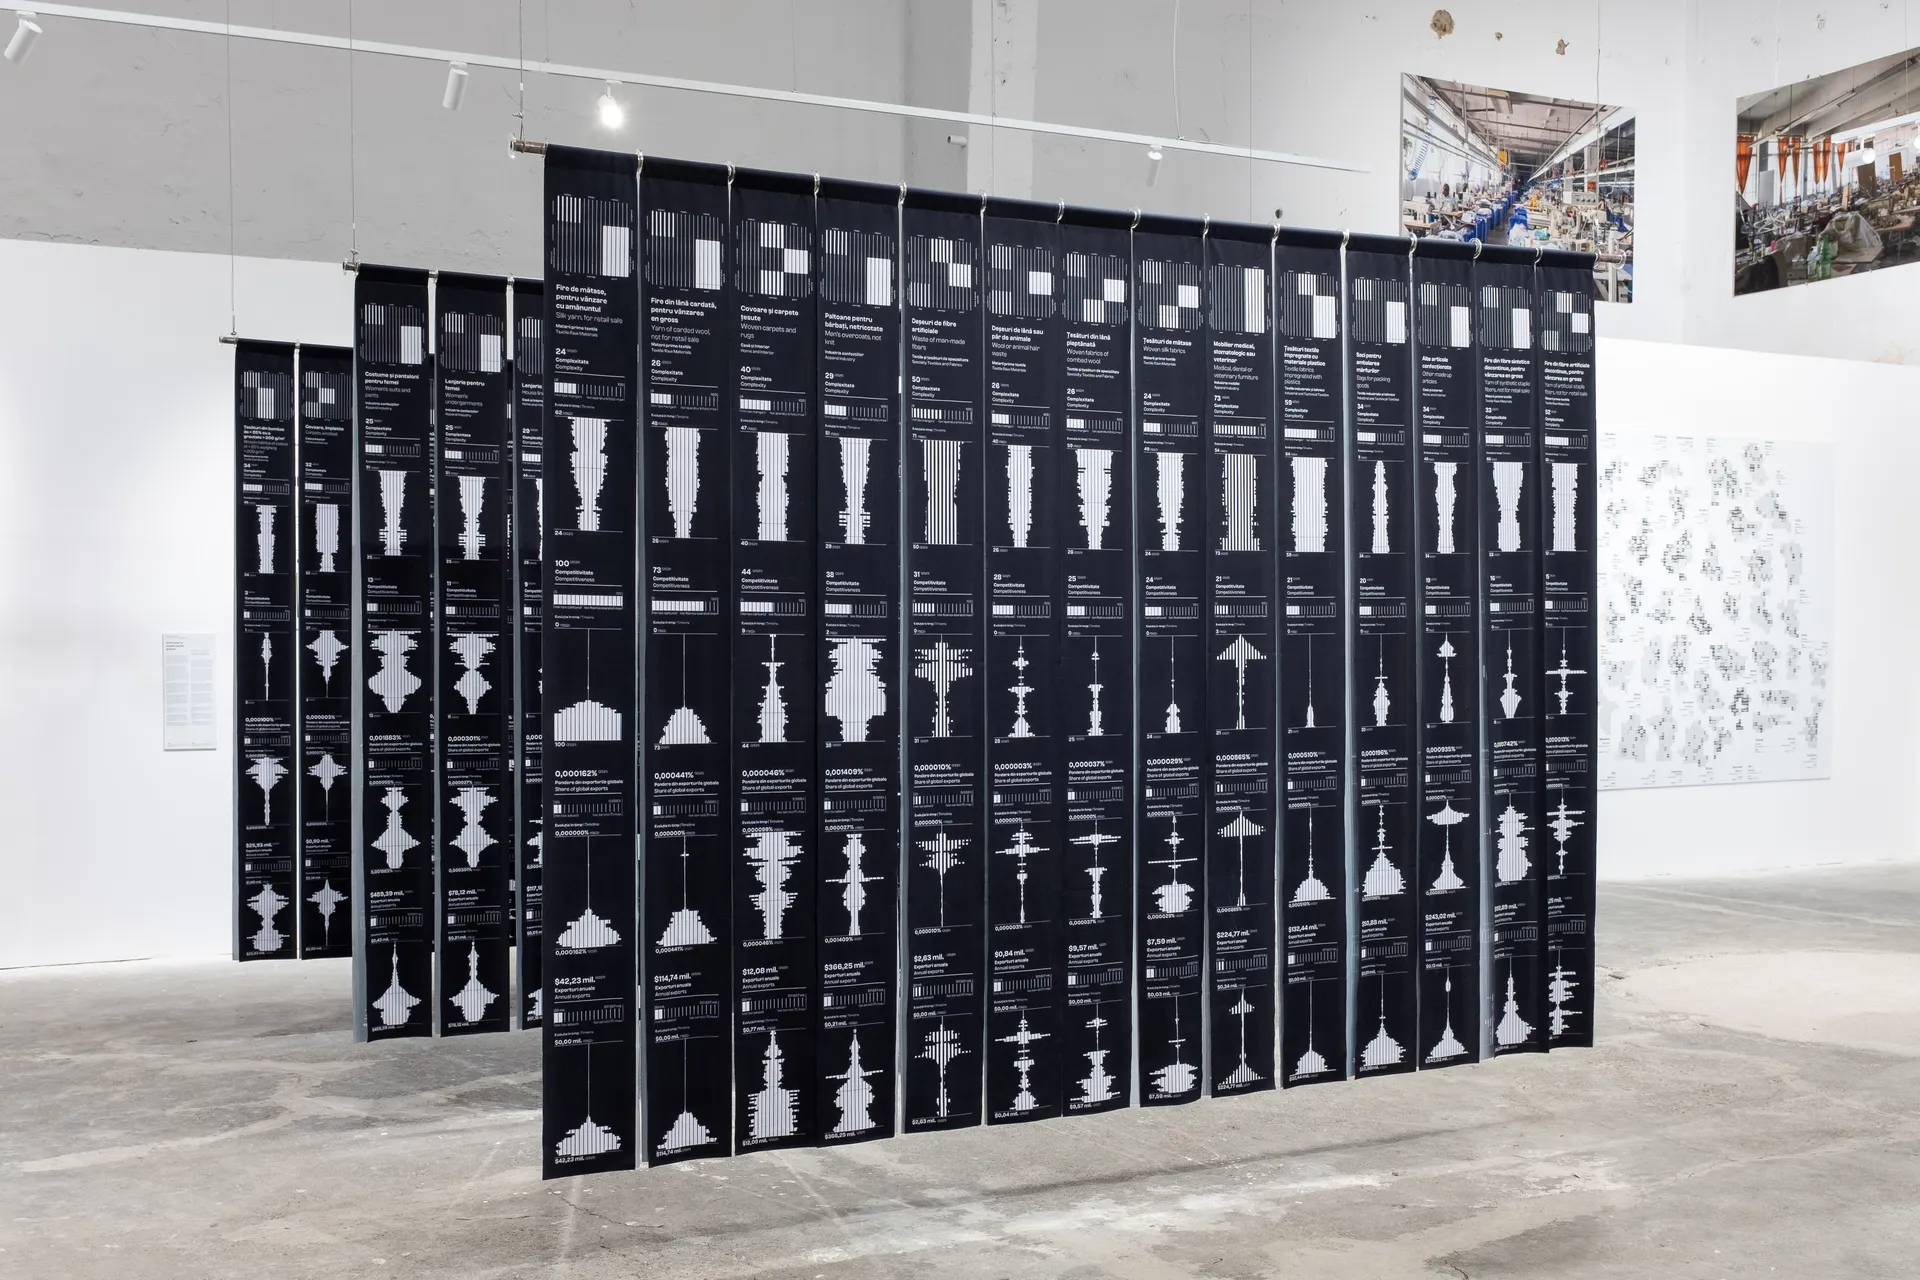
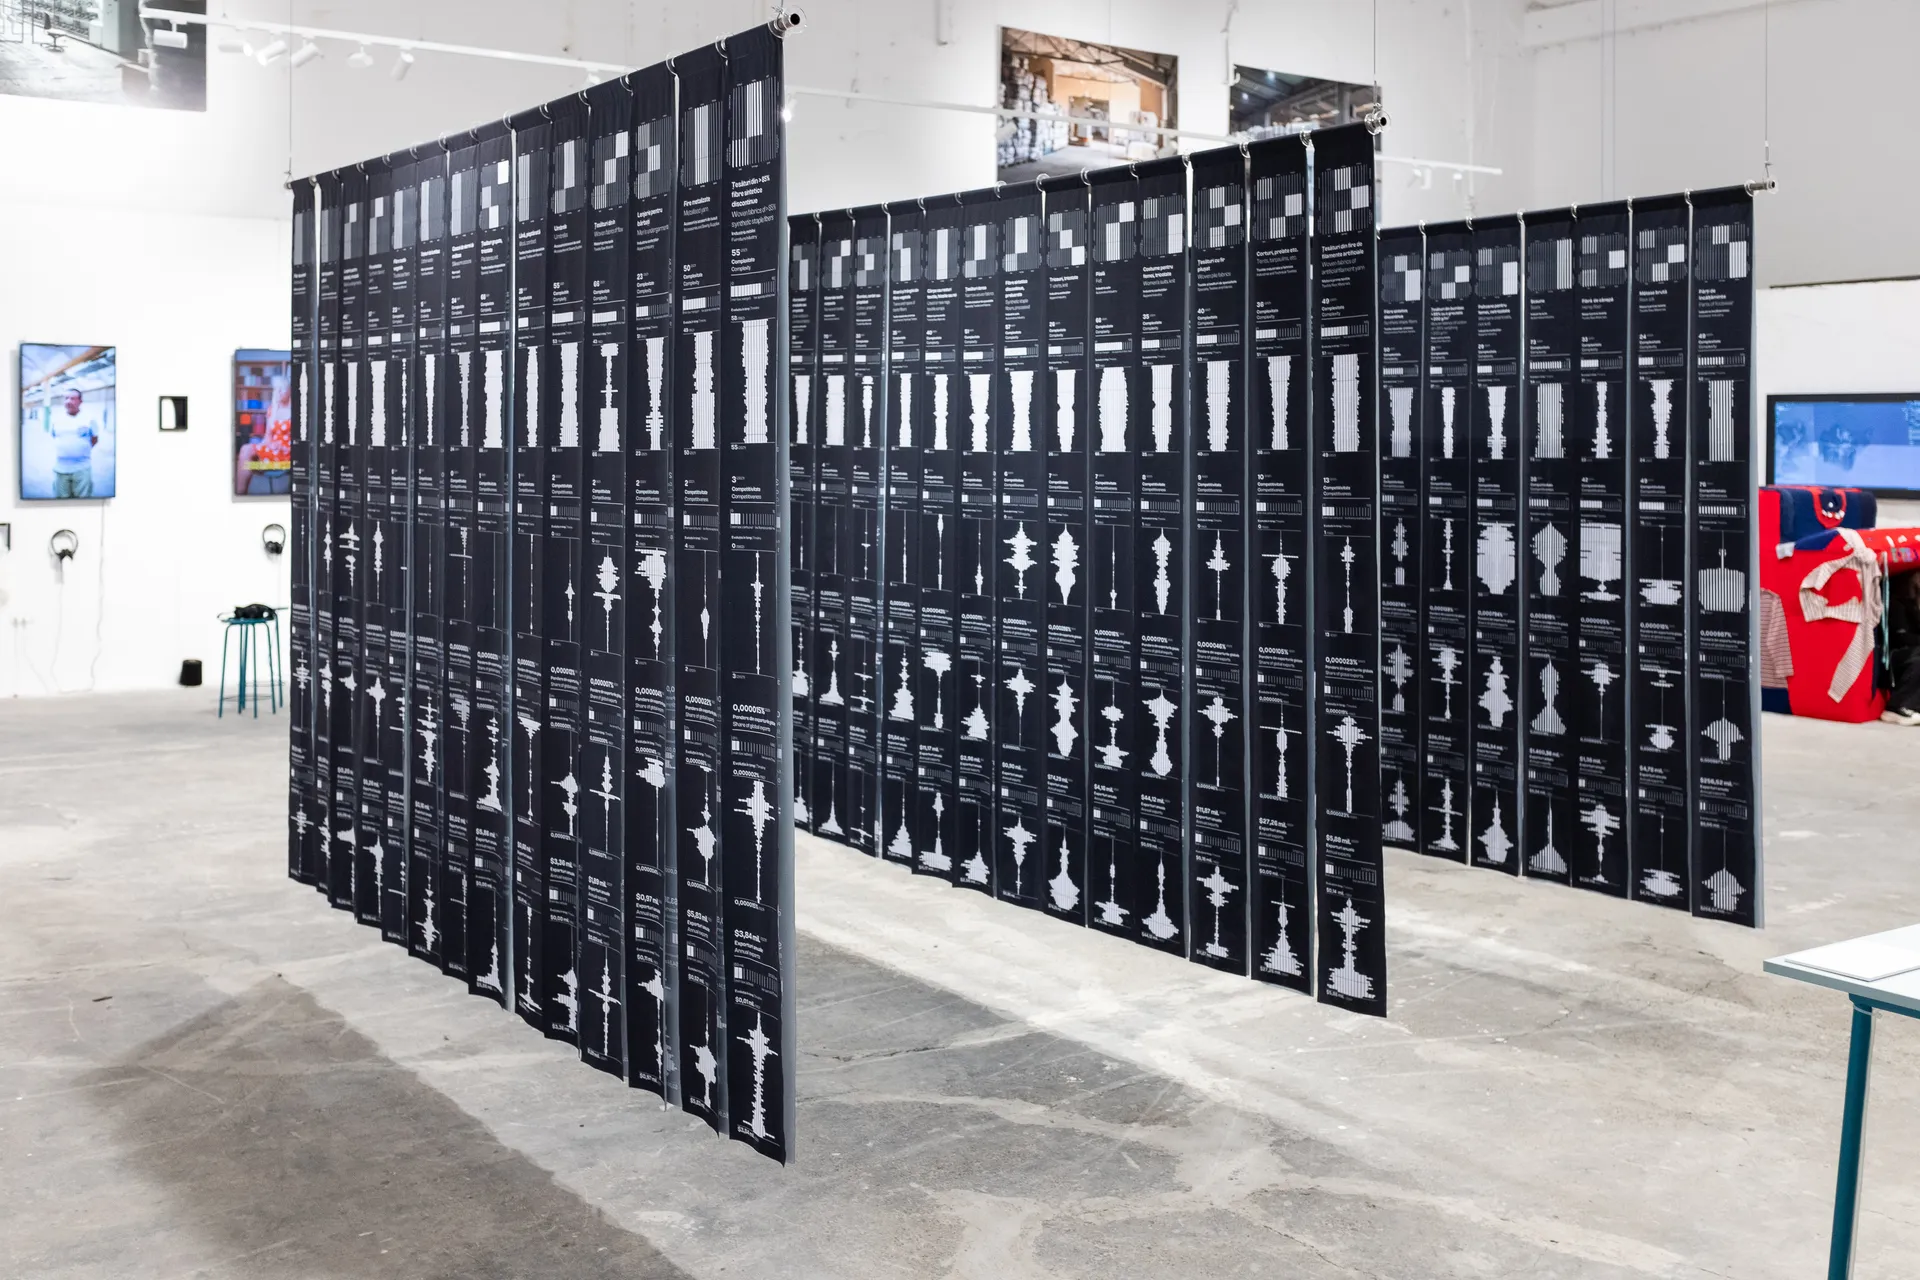
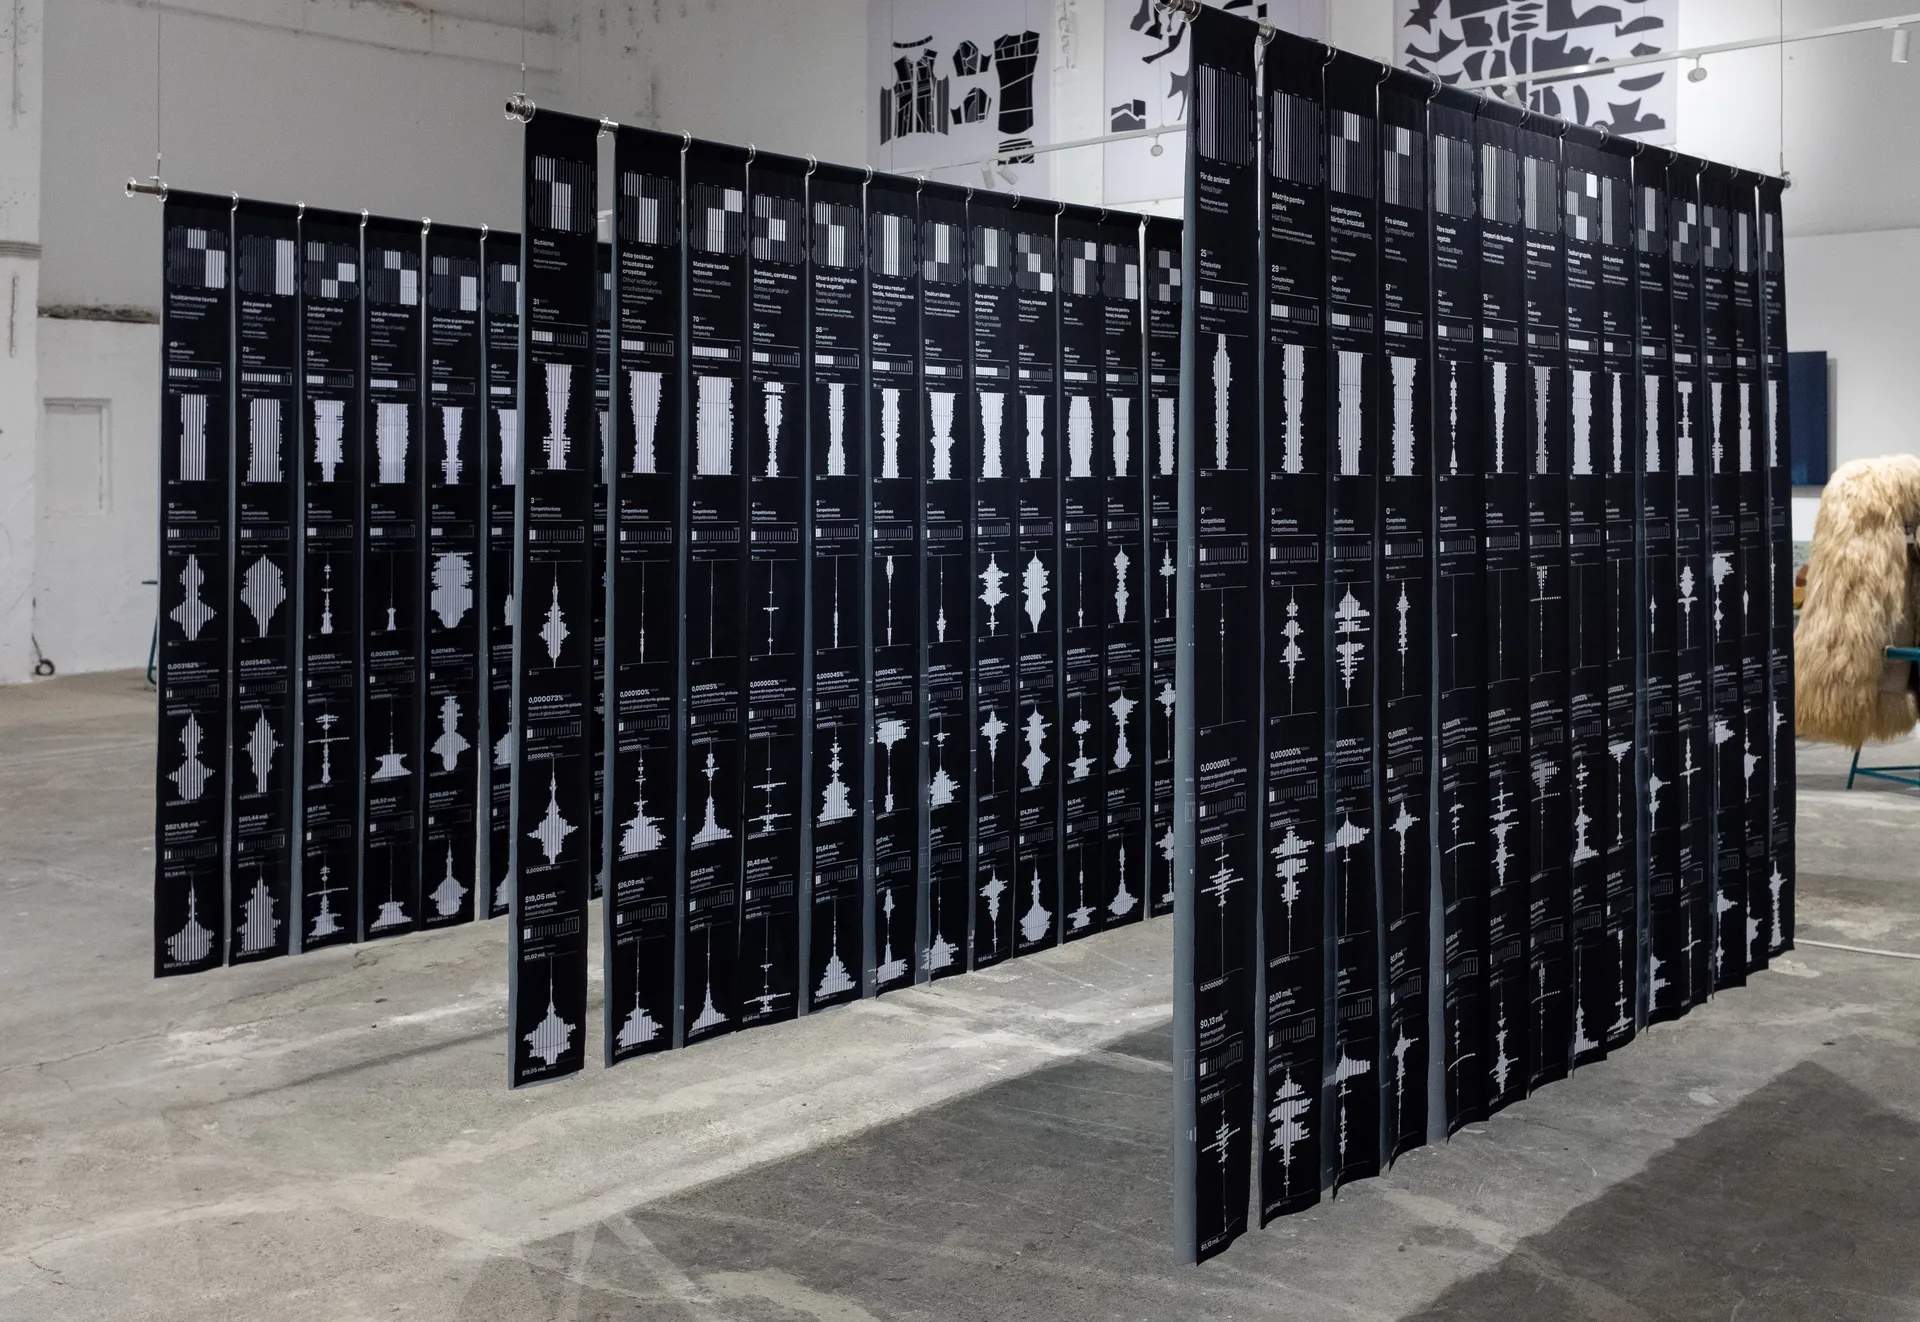
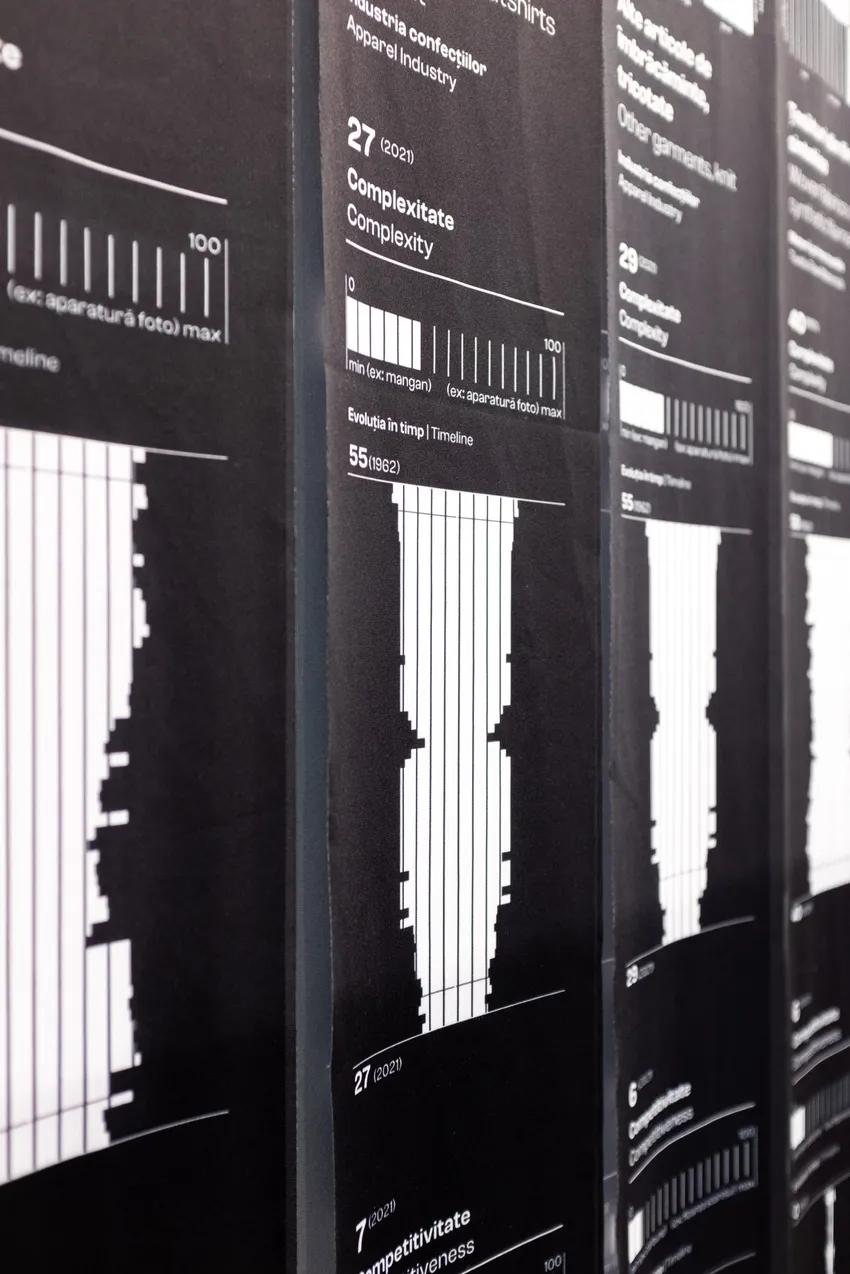
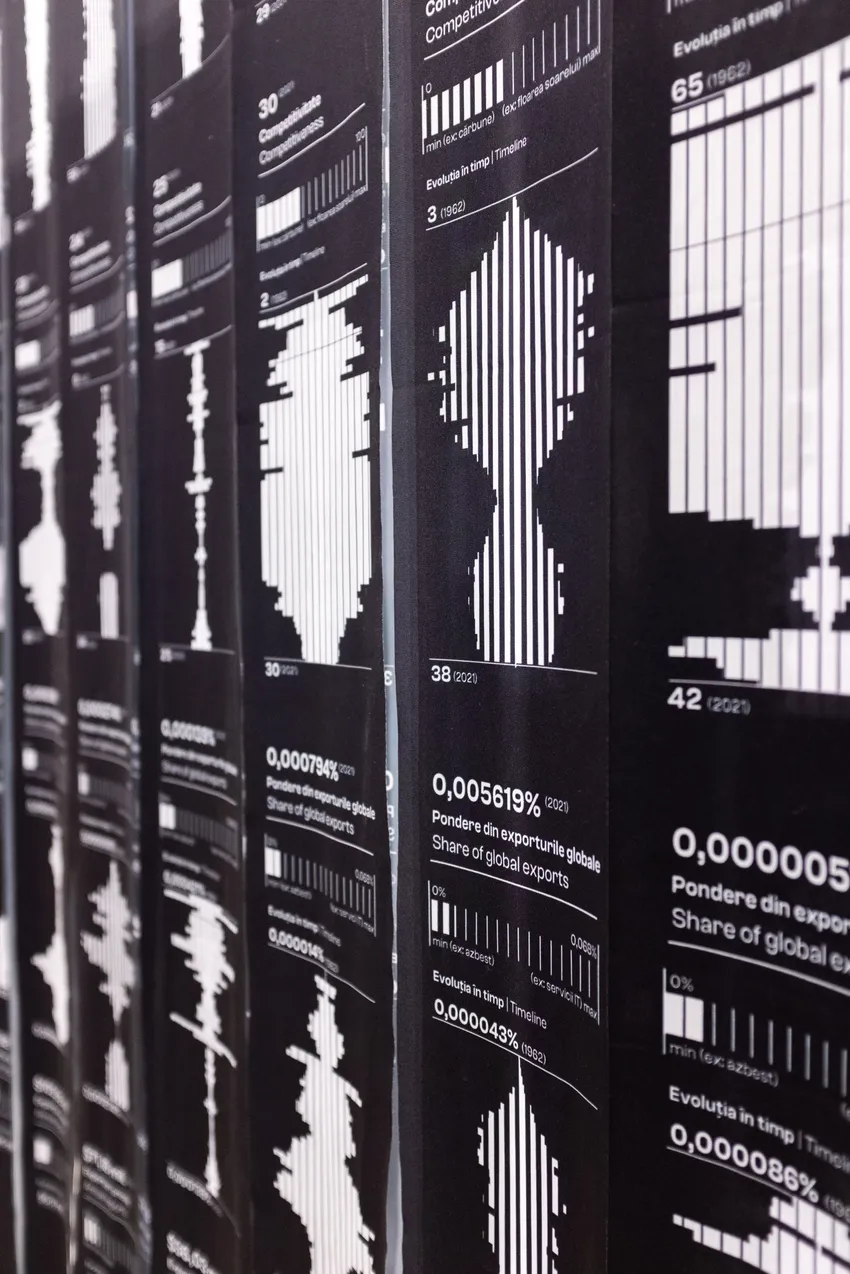
Product label grid
A set of 84 data avatars, each representing a Romanian textile product, arranged from most to least competitive (left to right and top to bottom) and displaying a streamlined view of each product's 2021 metrics.
Data source: Data source: Growth Lab at Harvard University, The Atlas of Economic Complexity. (2024). Retrieved from https://atlas.cid.harvard.edu/
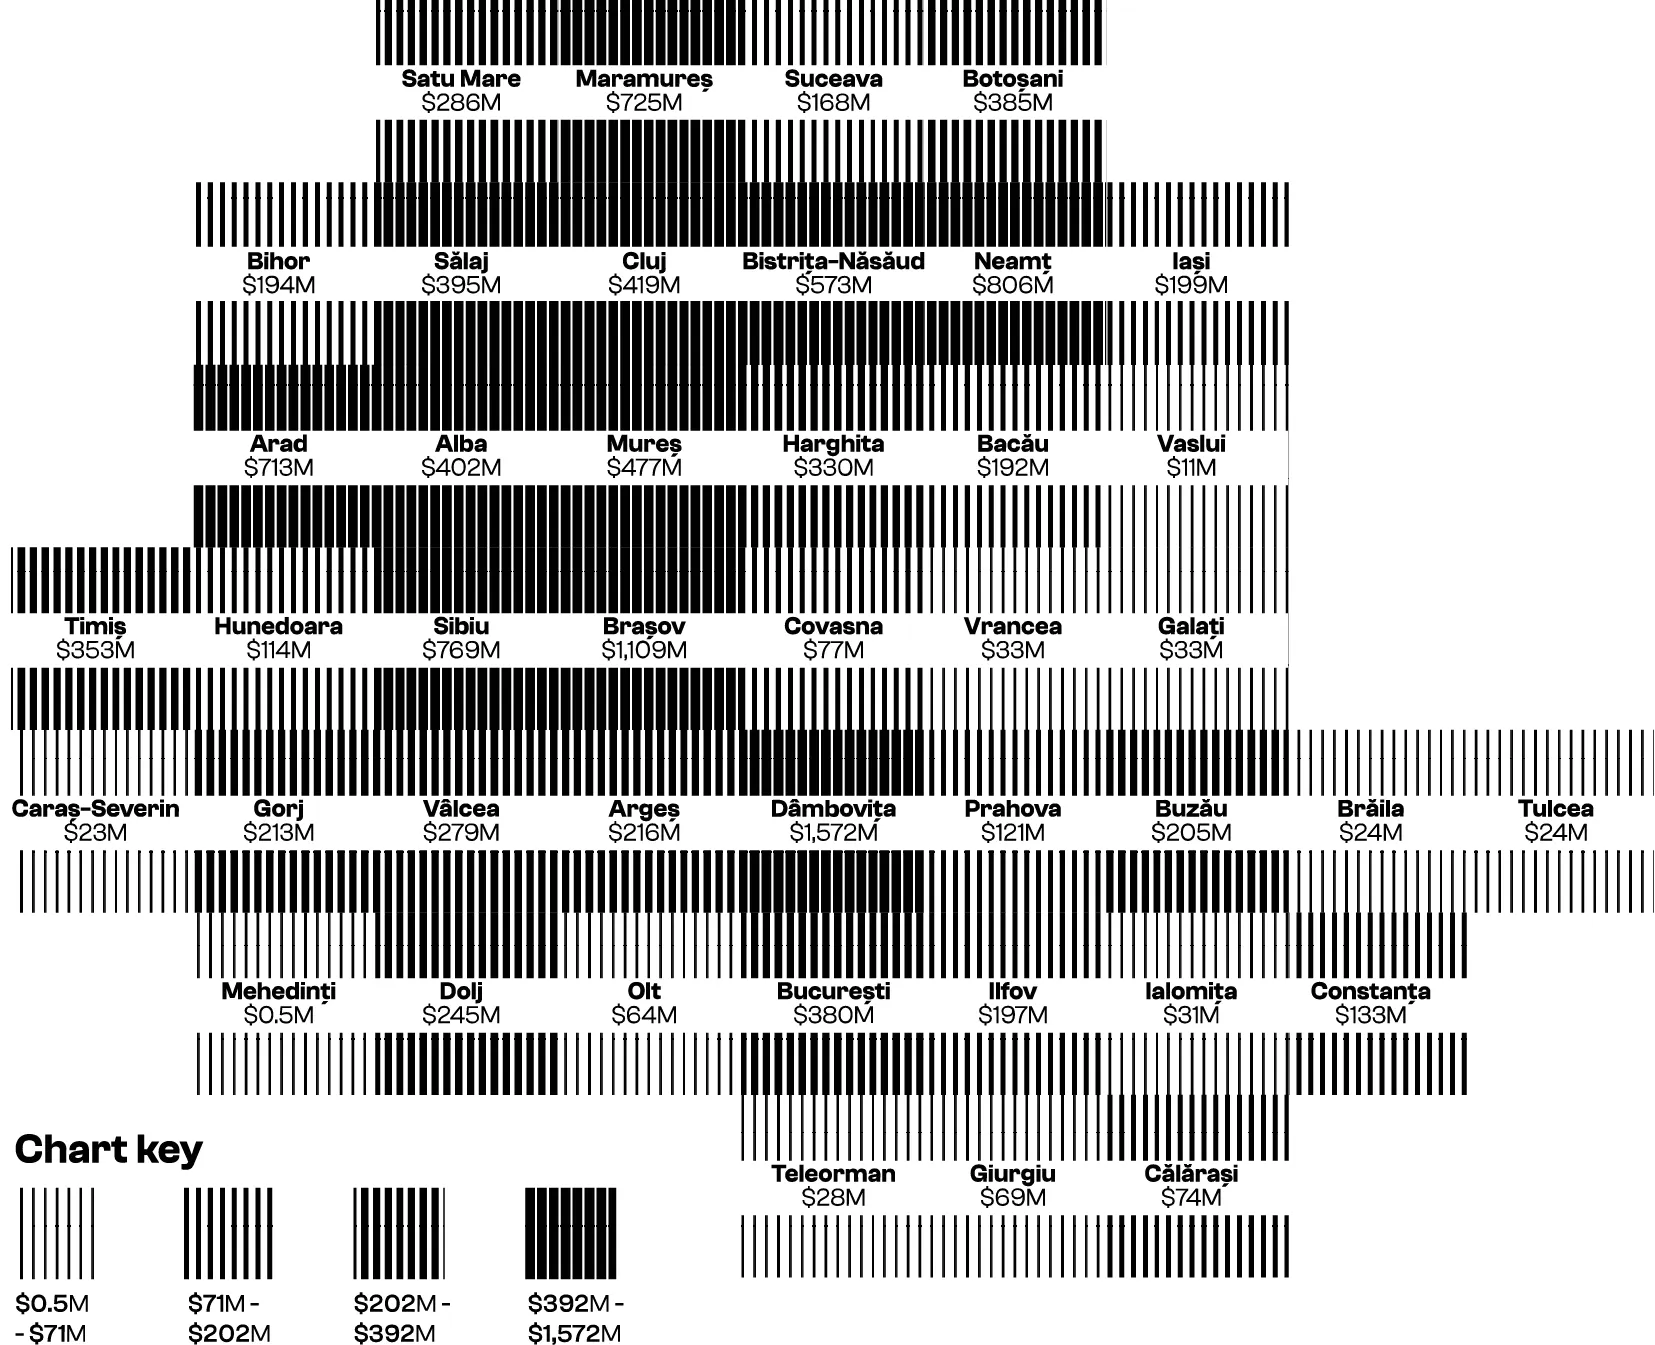
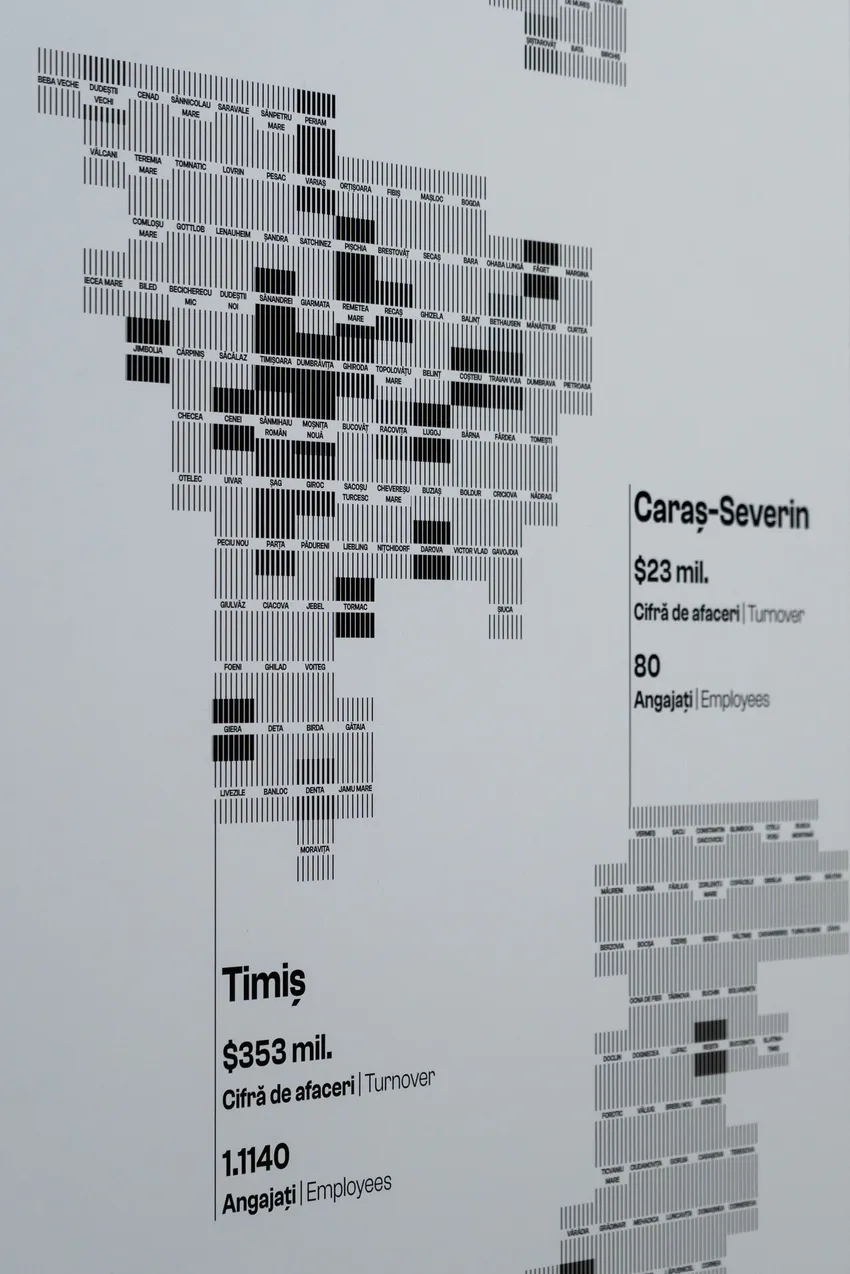
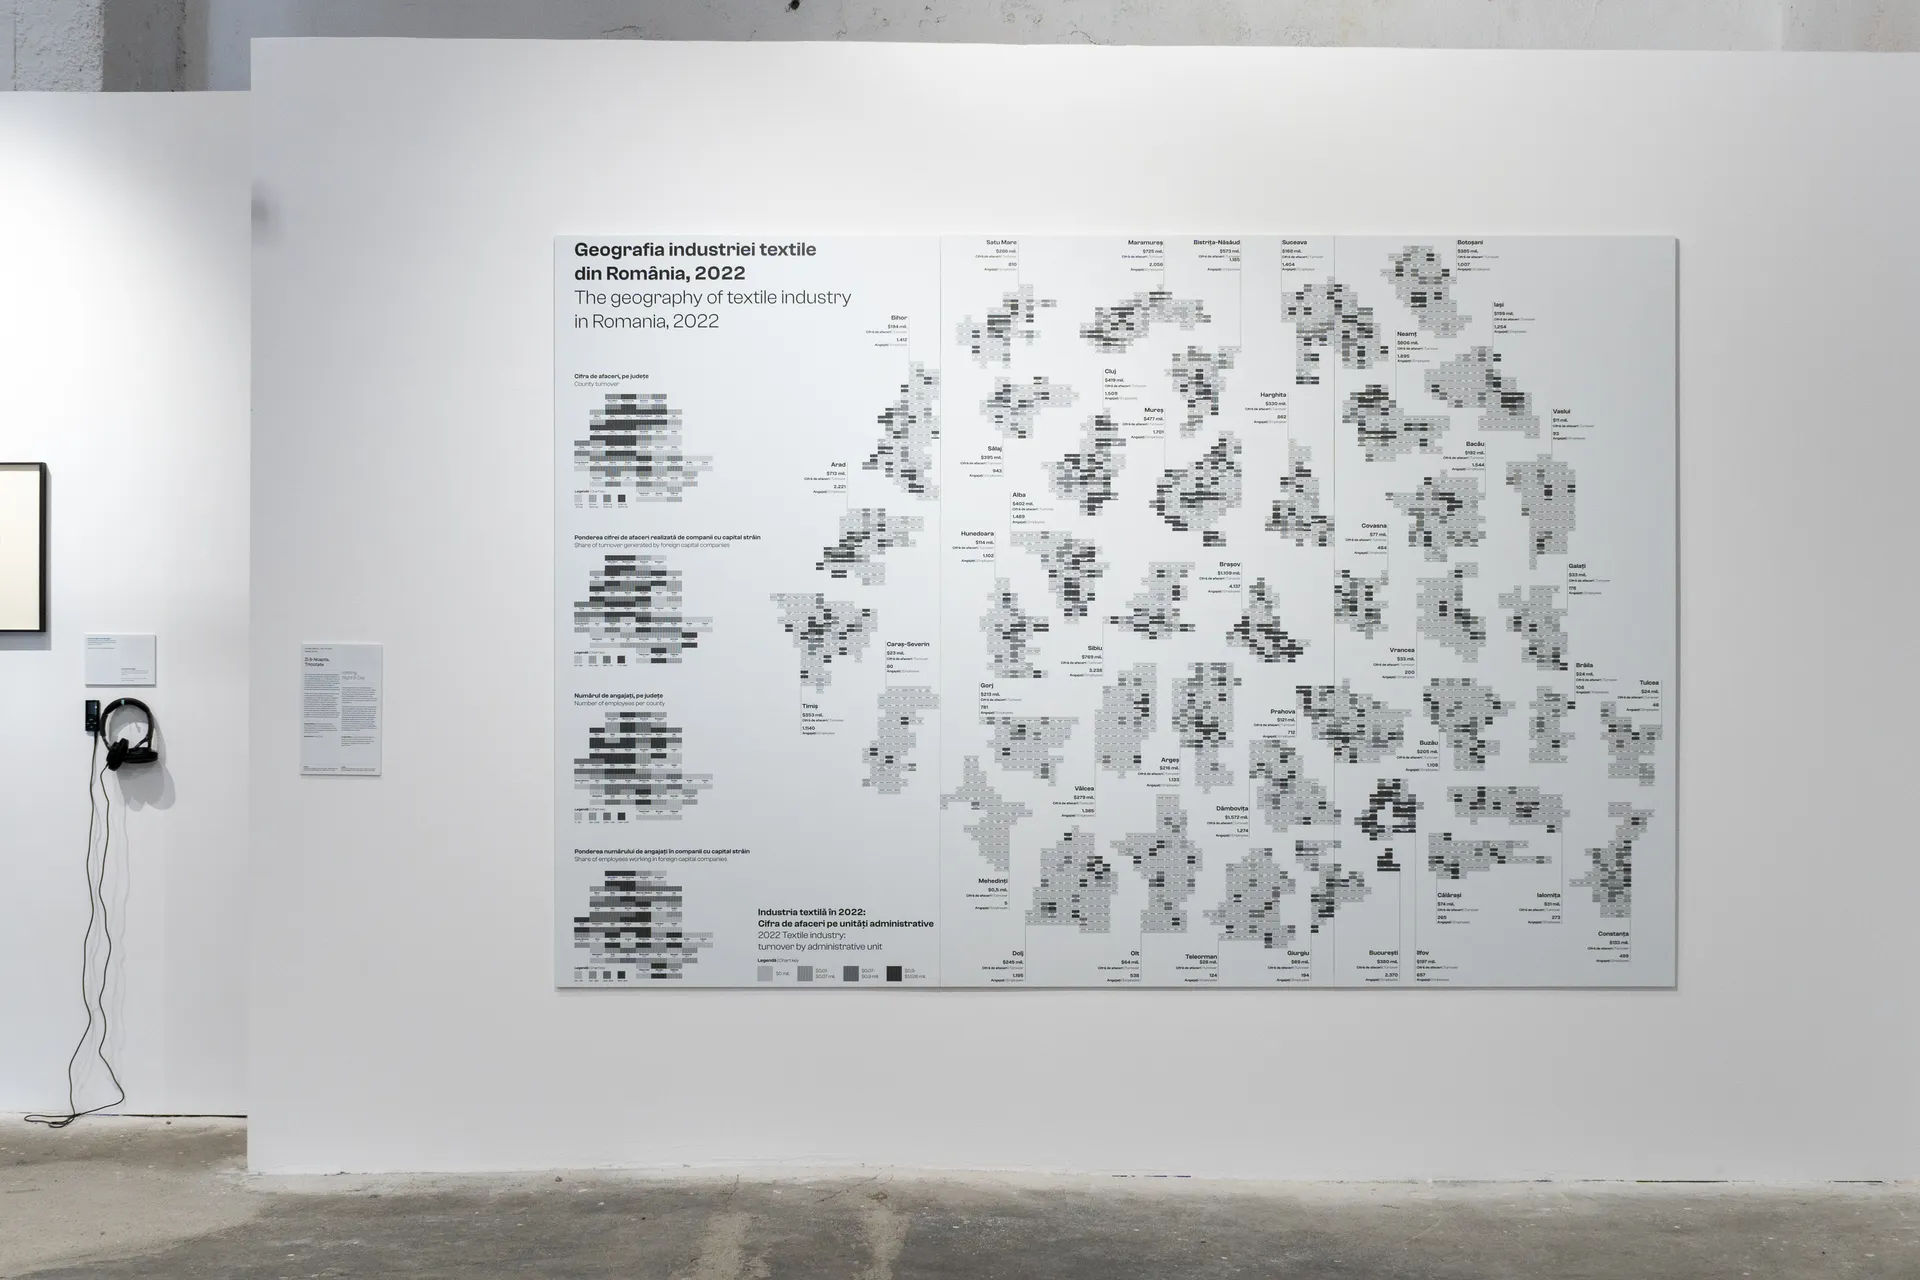
County turnover
Map of Romania displaying 2022 annual average turnover in the textile industry by county, with darker shades indicating higher turnover levels.
Data source: Companies Accounting Balance, Romanian Ministry of Finance (2024). Retrieved from https://data.gov.ro
National Trade Registry, Lista Firmelor din România web platform, BordDesign SRL (2024). Retrieved from https://www.listafirme.ro/
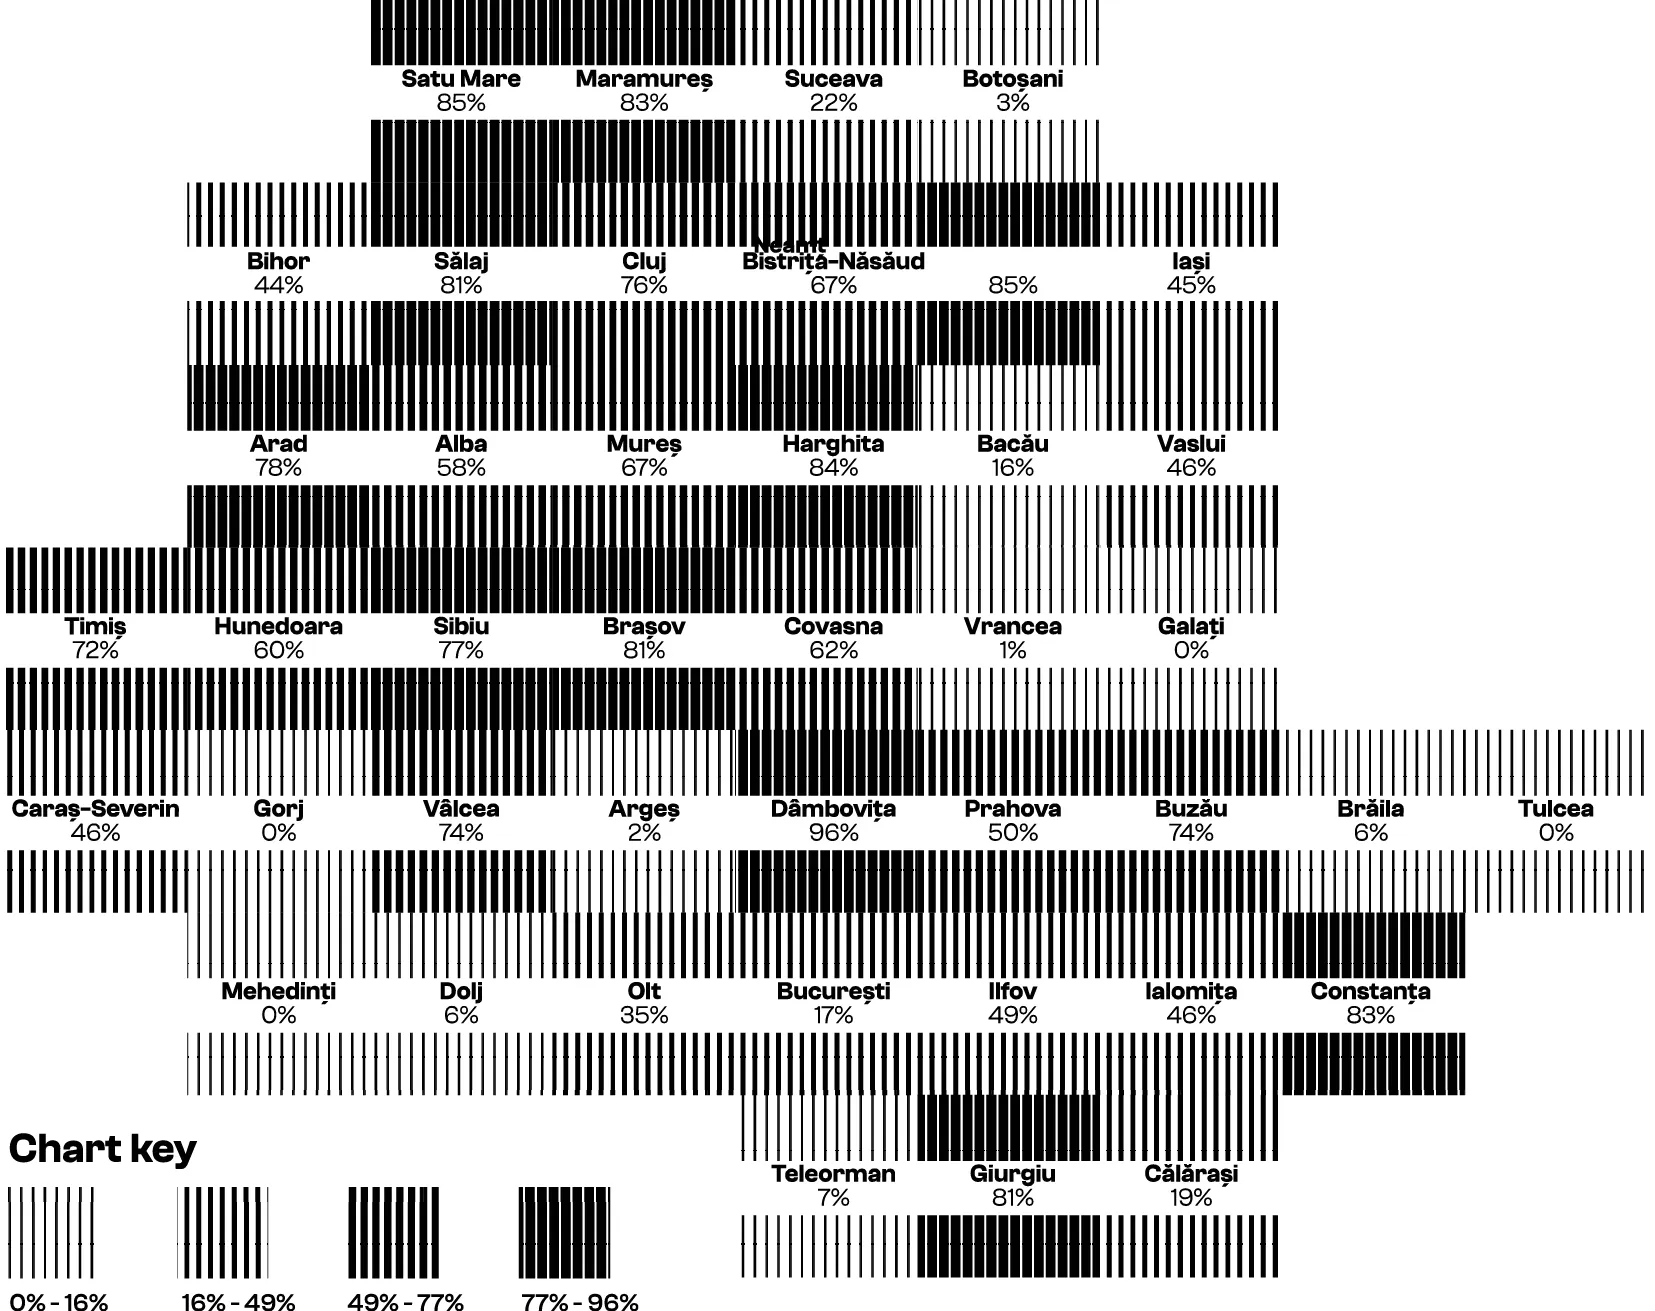
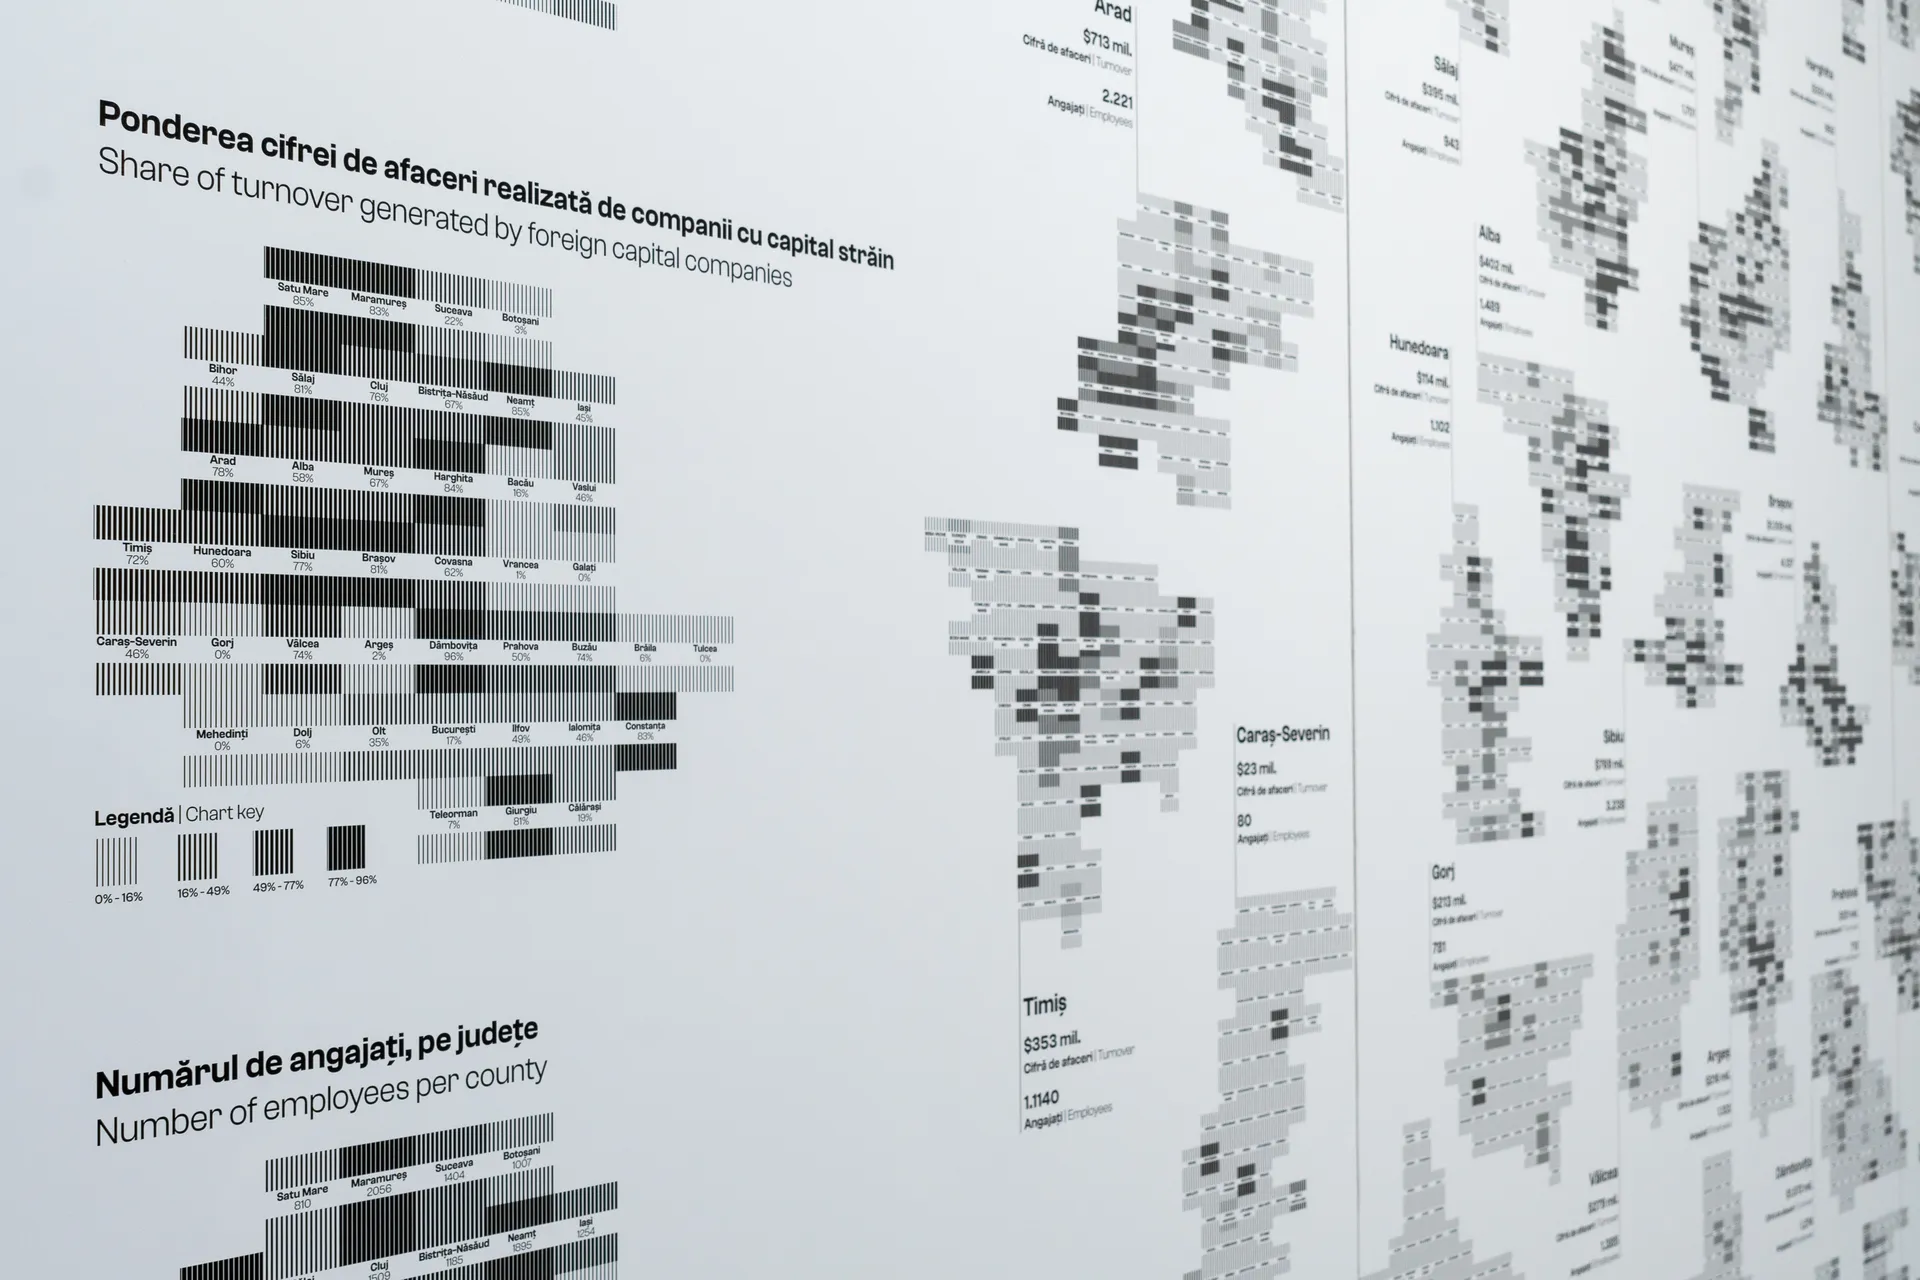
Share of turnover generated by foreign capital companies
Map of Romania showing the 2022 share of textile industry turnover generated by foreign-owned companies, with darker shades representing higher contribution levels.
Data source: Companies Accounting Balance, Romanian Ministry of Finance (2024). Retrieved from https://data.gov.ro
National Trade Registry, Lista Firmelor din România web platform, BordDesign SRL (2024). Retrieved from https://www.listafirme.ro/
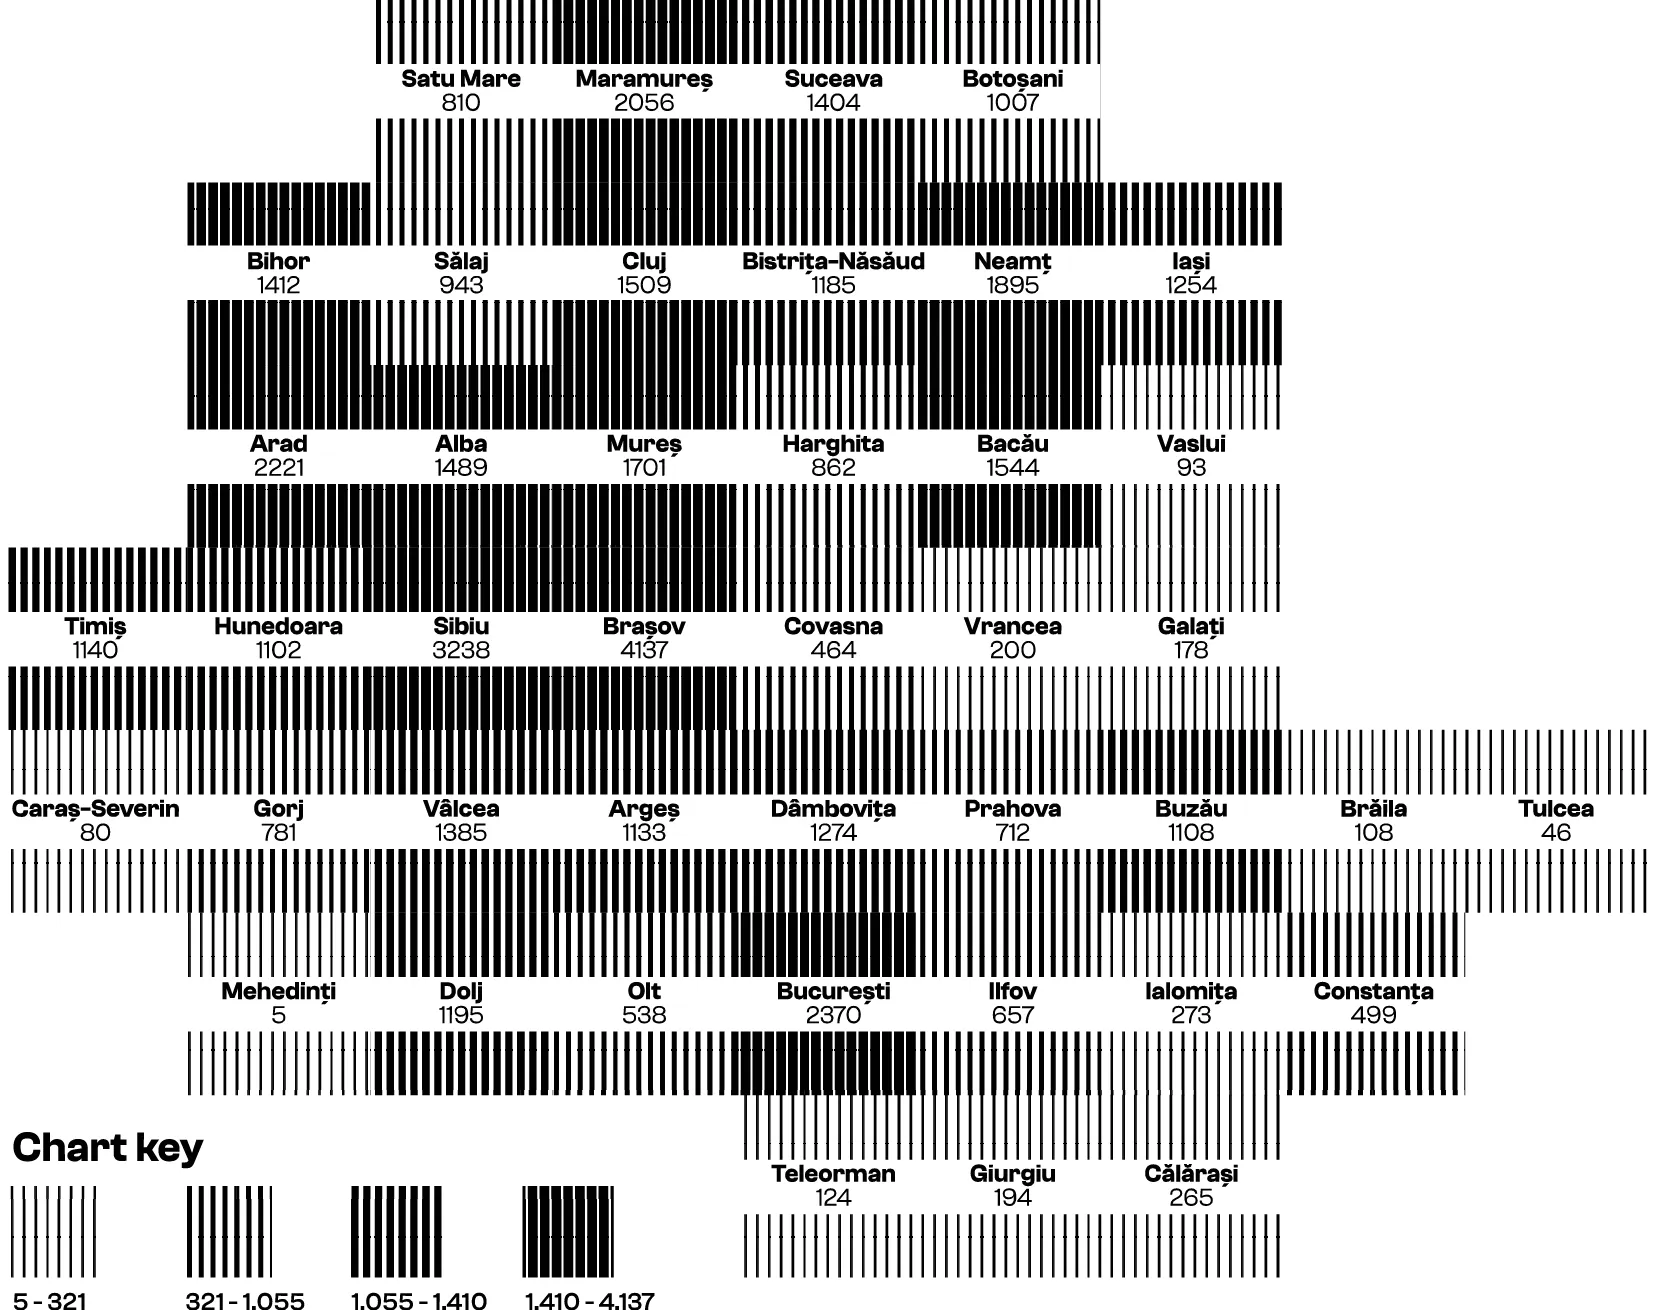
Number of employees per county
Map of Romania showing 2022 textile industry employment by county, with darker shades indicating higher employee counts.
Data source: Companies Accounting Balance, Romanian Ministry of Finance (2024). Retrieved from https://data.gov.ro
National Trade Registry, Lista Firmelor din România web platform, BordDesign SRL (2024). Retrieved from https://www.listafirme.ro/
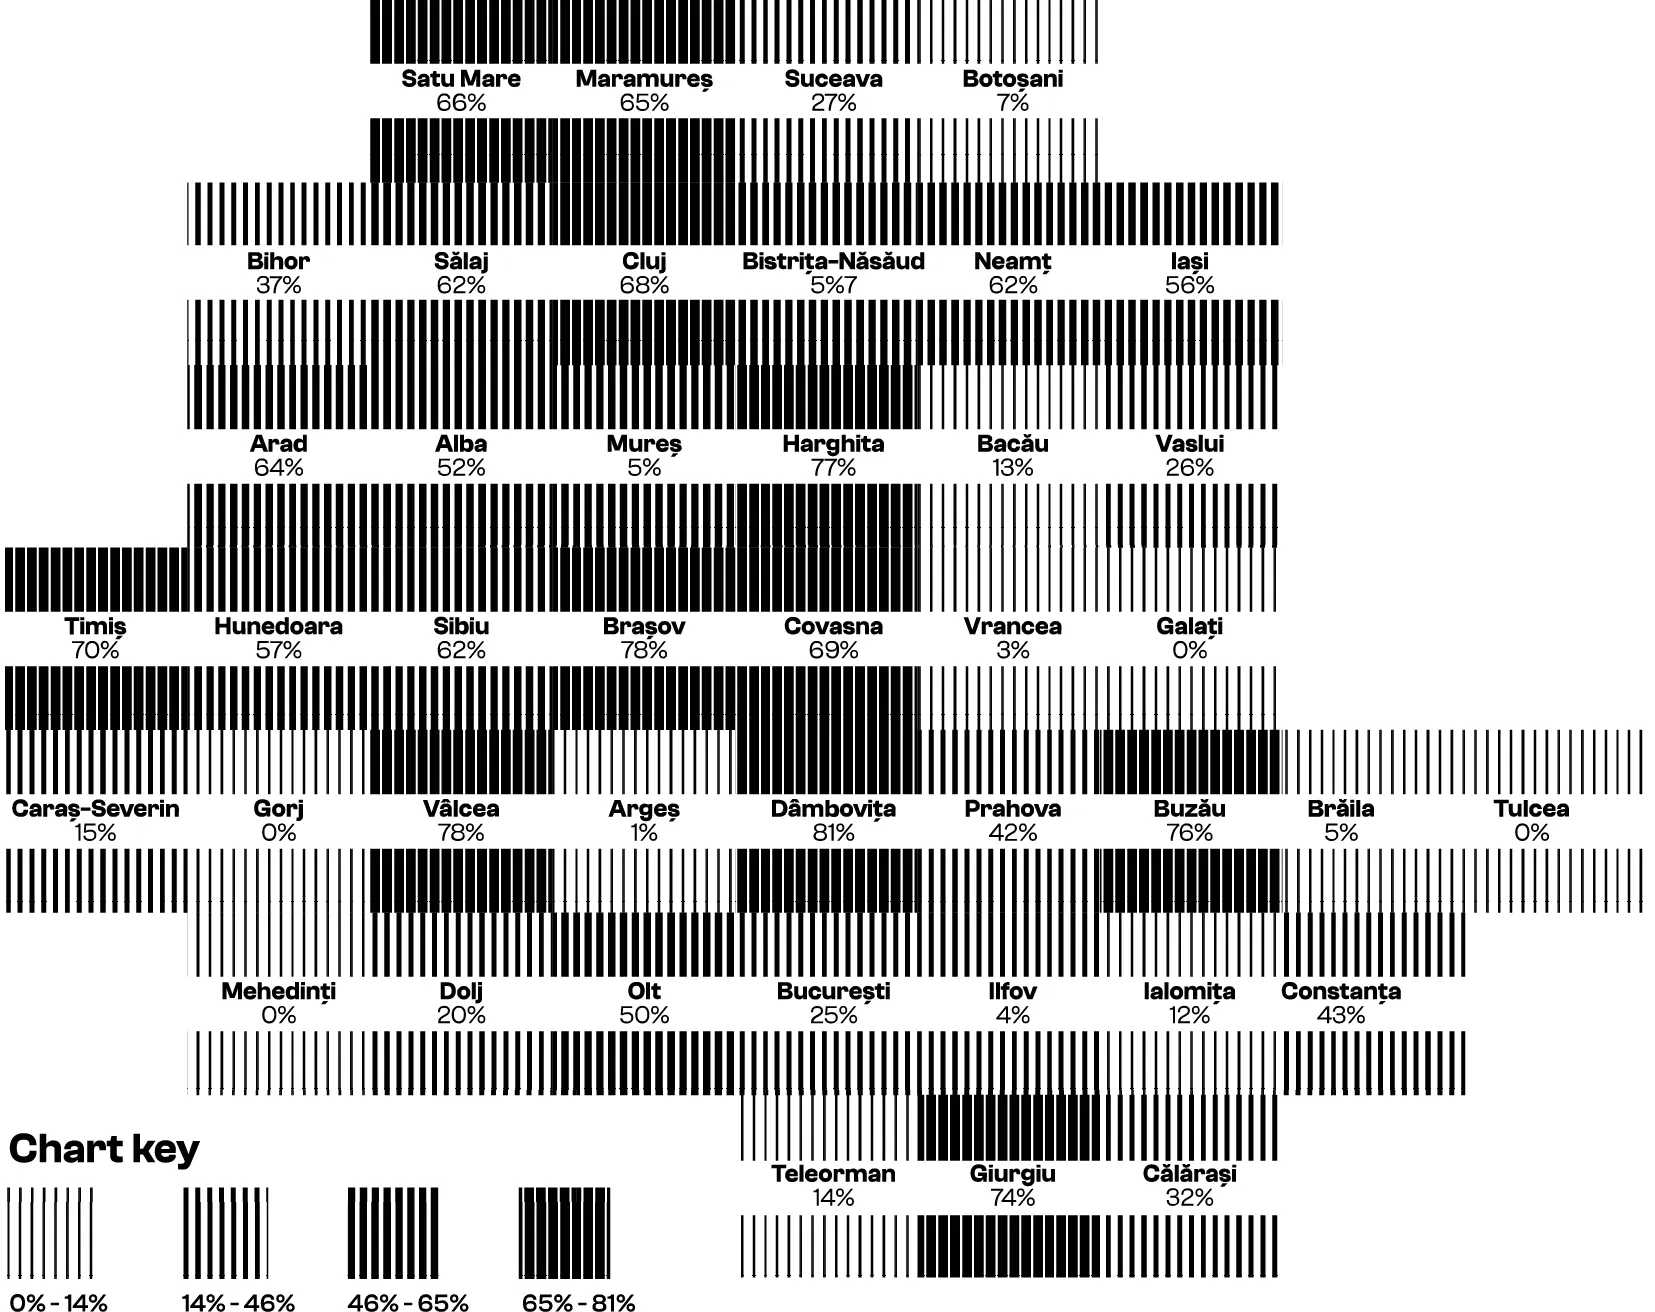
Share of employees working in foreign capital companies
Map of Romania illustrating the 2022 share of textile industry employees in foreign-owned companies, with darker shades representing higher proportions.
Data source: Companies Accounting Balance, Romanian Ministry of Finance (2024). Retrieved from https://data.gov.ro
National Trade Registry, Lista Firmelor din România web platform, BordDesign SRL (2024). Retrieved from https://www.listafirme.ro/
Credits
Studio Interrobang: (Răzvan Zamfira, Andreea Vrabie, Andra Zamfira), Victor Ionichi,
Researchers: Norbert Petrovici, Vlad Alexe, Mihai Iacob